Open Access
Fig. 17
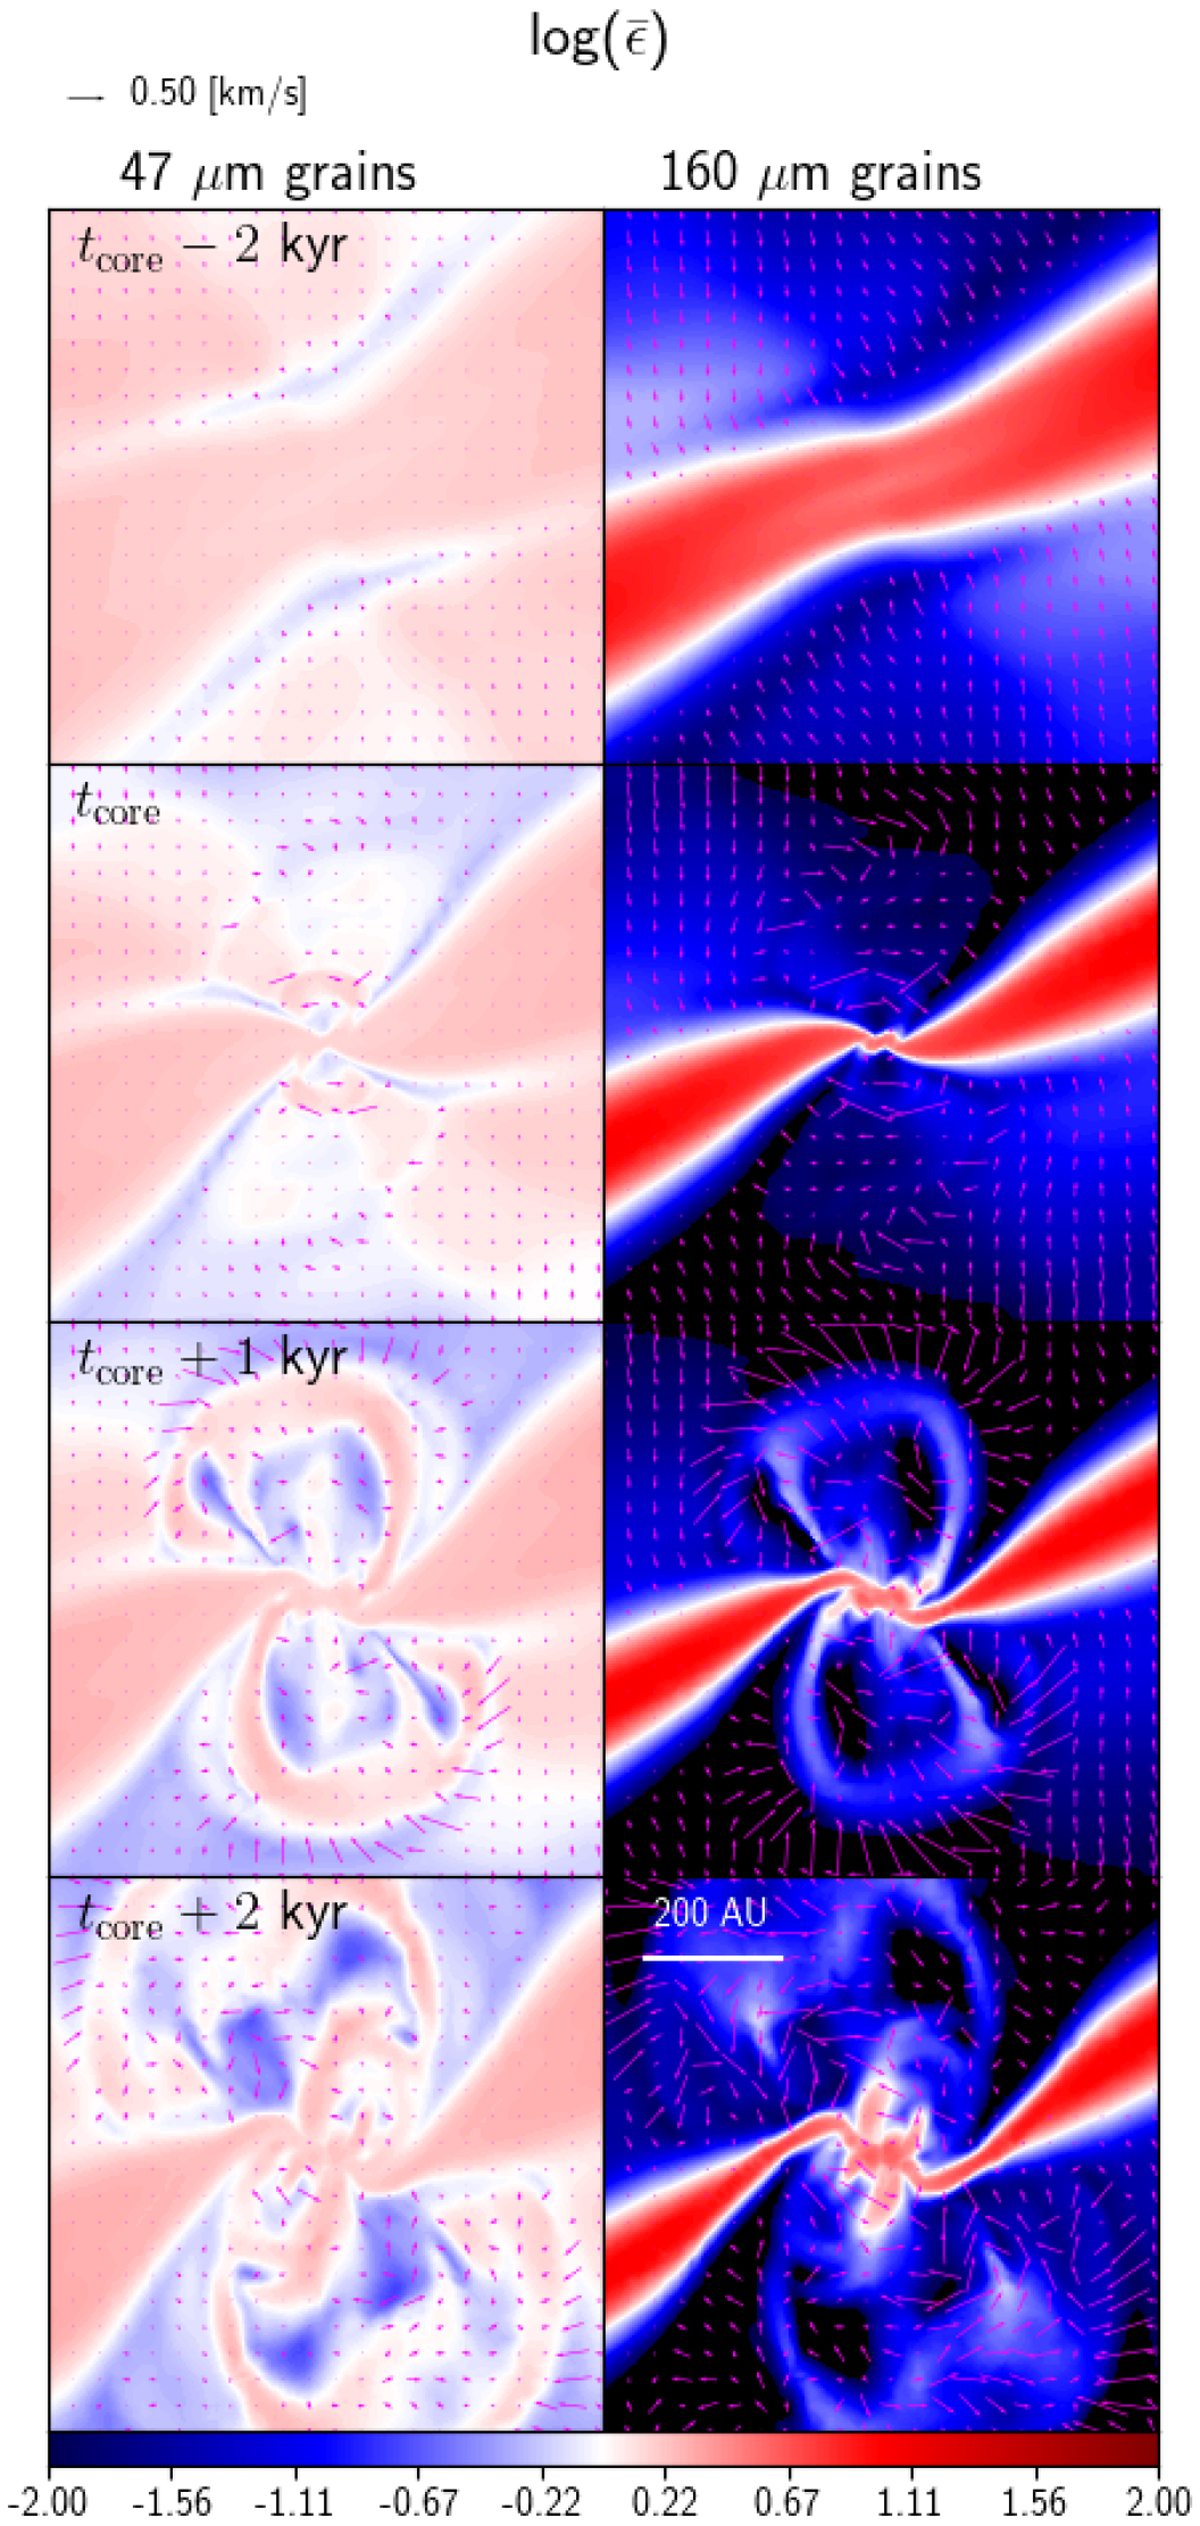
mmMRNmhd. Edge-on view of the relative variations of the dust ratio at four different times for the 47 μm (left) 160 μm grains (right). The magenta arrows represent the differential velocity with the barycenter. Regions that are dust depleted by more than two orders of magnitude are not displayed (black background).
Current usage metrics show cumulative count of Article Views (full-text article views including HTML views, PDF and ePub downloads, according to the available data) and Abstracts Views on Vision4Press platform.
Data correspond to usage on the plateform after 2015. The current usage metrics is available 48-96 hours after online publication and is updated daily on week days.
Initial download of the metrics may take a while.