Open Access
Fig. 15
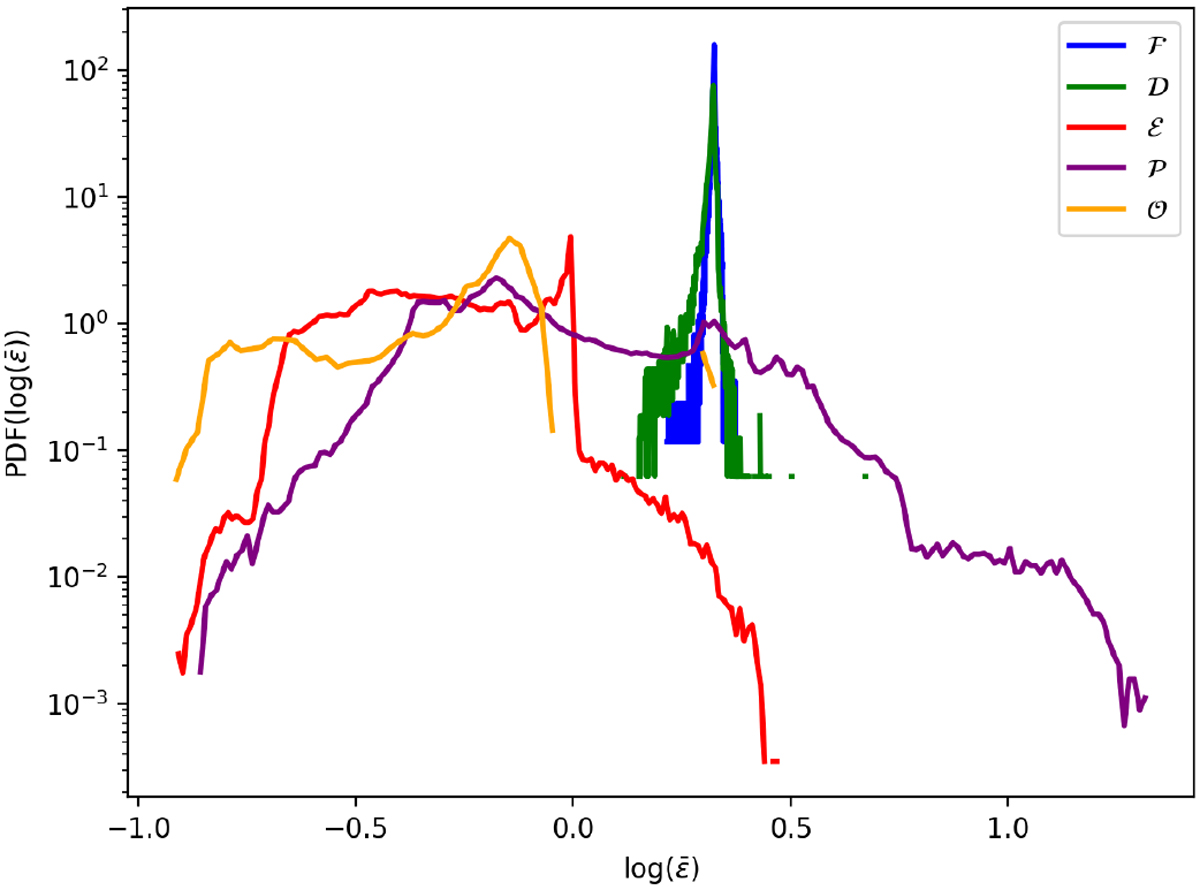
MMMRNNIMHD test at tcore + 2 kyr. Probability density function of the dust ratio enrichment ![]() in the core (blue), the disk (green), the pseudo-disk (purple), the outflow (orange) and the envelope (red). Dust is not a good tracer of gas here and the dust distribution is not uniform in the considered objects.
in the core (blue), the disk (green), the pseudo-disk (purple), the outflow (orange) and the envelope (red). Dust is not a good tracer of gas here and the dust distribution is not uniform in the considered objects.
Current usage metrics show cumulative count of Article Views (full-text article views including HTML views, PDF and ePub downloads, according to the available data) and Abstracts Views on Vision4Press platform.
Data correspond to usage on the plateform after 2015. The current usage metrics is available 48-96 hours after online publication and is updated daily on week days.
Initial download of the metrics may take a while.