Fig. 8.
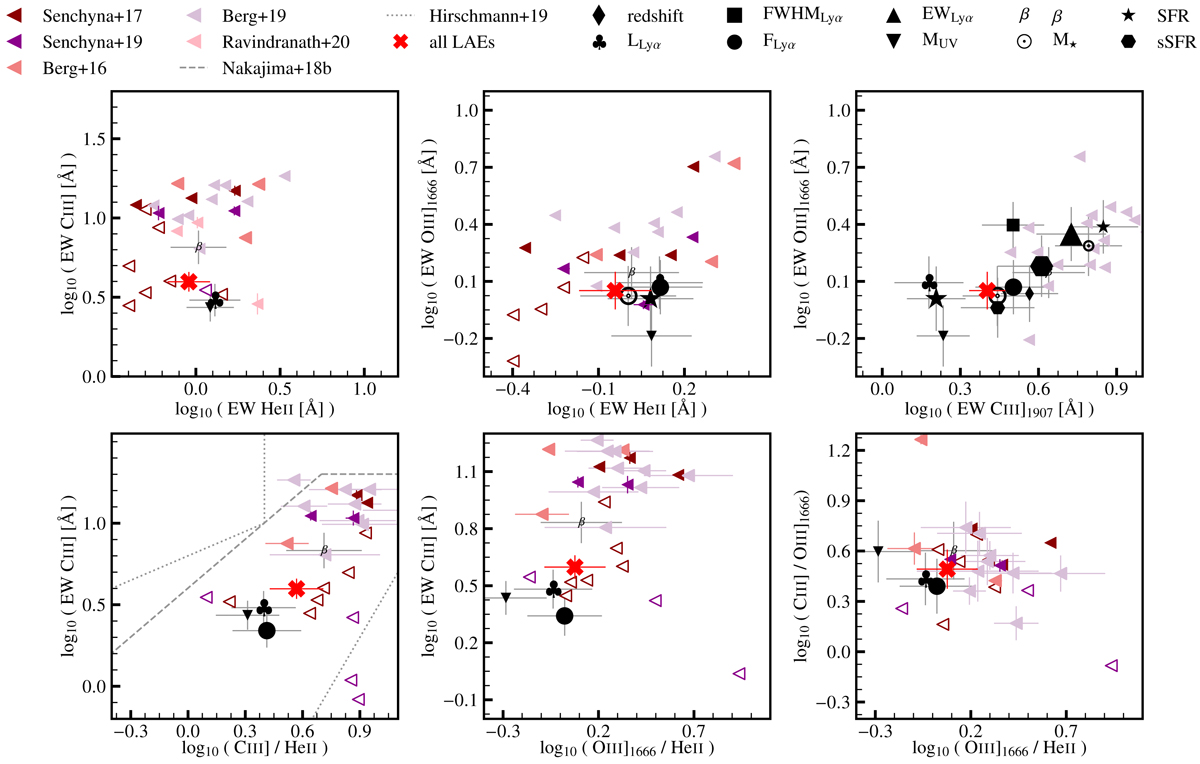
UV emission line properties of MUSE HUDF LAE subsamples and local galaxies from the literature described in Sects. 4.1 and 5.2. The diagrams show different combinations of EWs and ratios of the He II, O III]λ1666, C III], and [C III]λ1907 emission lines. Different black symbols refer to S/N > 2.5 line detections for different LAE subsamples and the red cross to the total LAE sample. Smaller and larger symbols indicate the subsample of LAEs whose property is lower or higher than the median value, respectively. Different colors refer to different samples from the literature, as labelled in the legend. Open and filled symbols indicate upper limits and detections, respectively. The left triangles refer to local galaxies. The gray dashed lines are the separation criteria between AGN and star-forming galaxies from Nakajima et al. (2018b), while the gray dotted lines represent the selection criteria for the AGN, composite, and star-forming galaxies from Hirschmann et al. (2019).
Current usage metrics show cumulative count of Article Views (full-text article views including HTML views, PDF and ePub downloads, according to the available data) and Abstracts Views on Vision4Press platform.
Data correspond to usage on the plateform after 2015. The current usage metrics is available 48-96 hours after online publication and is updated daily on week days.
Initial download of the metrics may take a while.