Fig. 7.
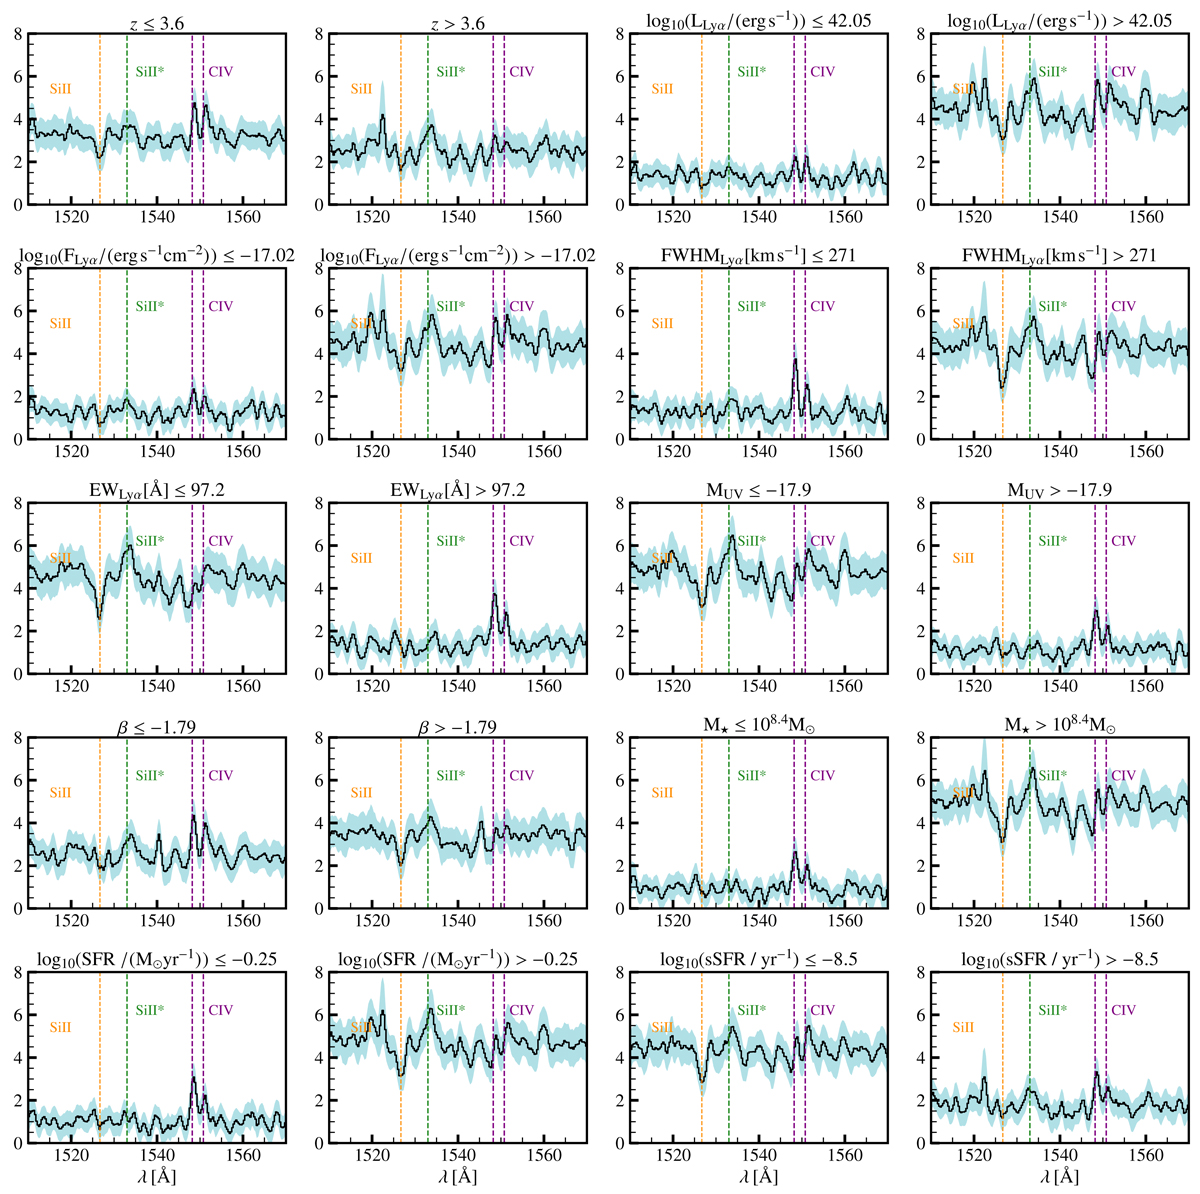
Zoom-in around the rest wavelengths of the C IVλλ1548,1551 doublet (purple vertical lines) for the different averaged spectra (black lines) of the MUSE HUDF LAEs (as described in the title of each panel). The light blue shading indicates the noise. The other vertical lines indicate the rest-frame wavelengths of the Si IIλ1527 ISM absorption feature (orange) and the SiII*λ1533 fine-structure transition (green).
Current usage metrics show cumulative count of Article Views (full-text article views including HTML views, PDF and ePub downloads, according to the available data) and Abstracts Views on Vision4Press platform.
Data correspond to usage on the plateform after 2015. The current usage metrics is available 48-96 hours after online publication and is updated daily on week days.
Initial download of the metrics may take a while.