Fig. 6.
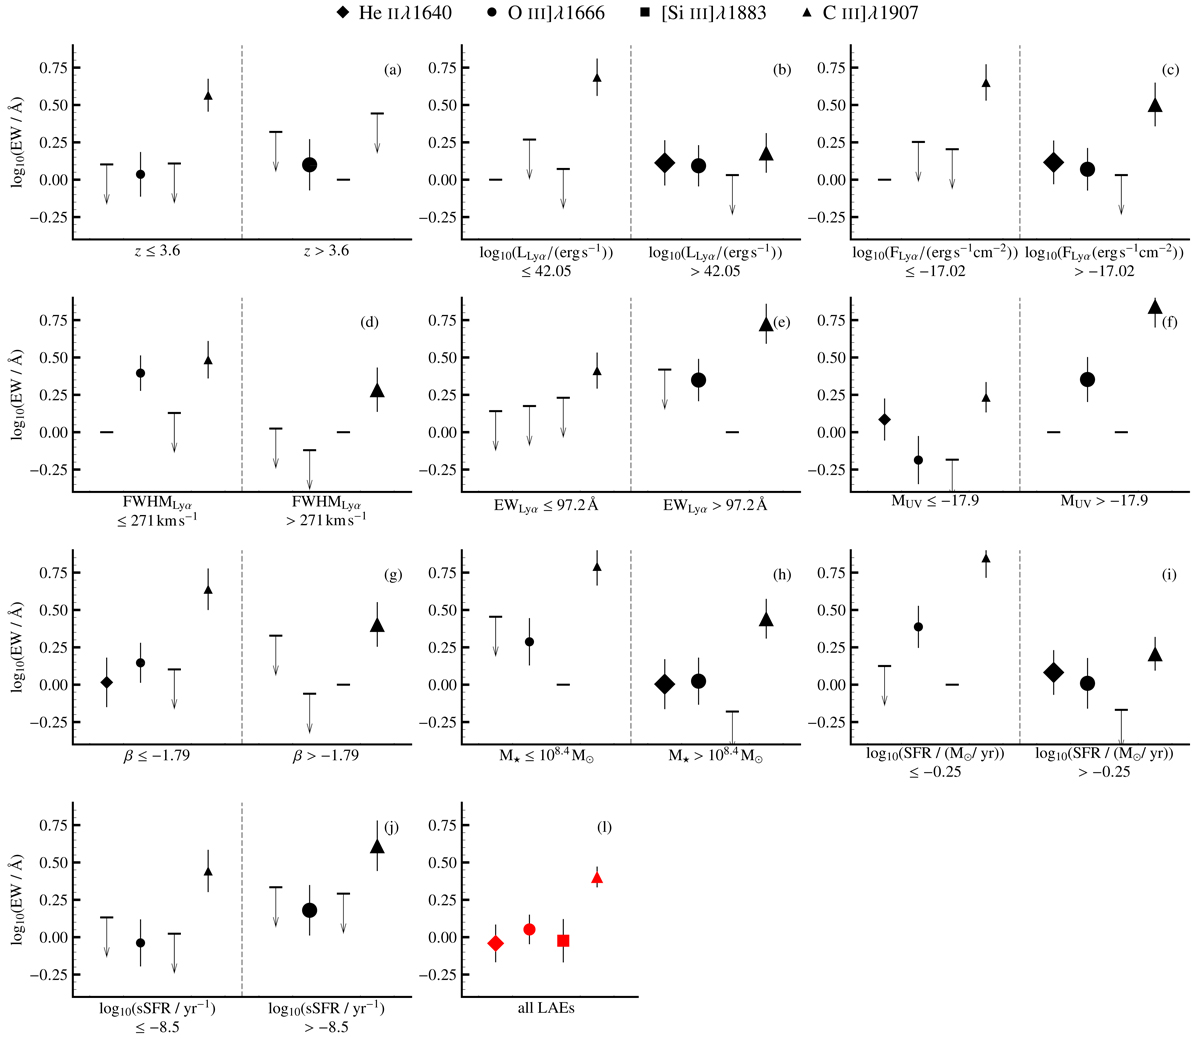
EWs of He II, O III]λ1666, [Si III]λ1883, and [C III]λ1907 for the different subsamples of MUSE HUDF LAEs (x-axis). The symbols refer to different emission lines, as labeled in the legend. Smaller and larger symbol sizes indicate the subsample of LAEs whose properties are lower and higher than the median value, respectively. Empty symbols with downward arrows indicate upper limits, while non-detections are shown by the black dash. Red symbols show the EWs for all 220 LAEs in the sample.
Current usage metrics show cumulative count of Article Views (full-text article views including HTML views, PDF and ePub downloads, according to the available data) and Abstracts Views on Vision4Press platform.
Data correspond to usage on the plateform after 2015. The current usage metrics is available 48-96 hours after online publication and is updated daily on week days.
Initial download of the metrics may take a while.