Fig. 5.
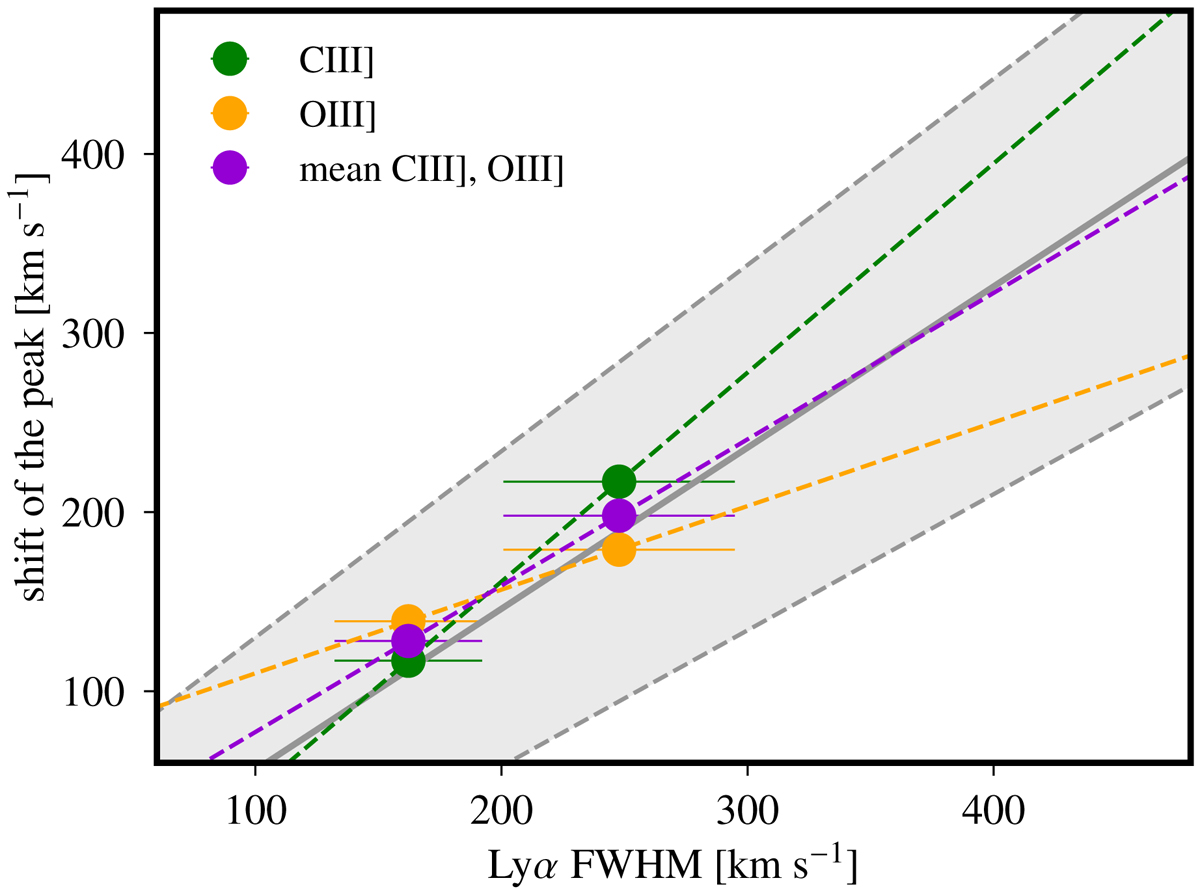
Correlations between shift of Lyα peak and Lyα FWHM obtained from Lyα FWHM subsamples of our LAEs. These correlations were obtained considering the rest wavelengths of C III] (green line) and O III] (orange line) as reference wavelengths and their mean shift (purple line). In gray, Eq. (2) of V18, obtained from object-by-object measurements, and the associated scatter (gray shaded area).
Current usage metrics show cumulative count of Article Views (full-text article views including HTML views, PDF and ePub downloads, according to the available data) and Abstracts Views on Vision4Press platform.
Data correspond to usage on the plateform after 2015. The current usage metrics is available 48-96 hours after online publication and is updated daily on week days.
Initial download of the metrics may take a while.