Fig. 3.
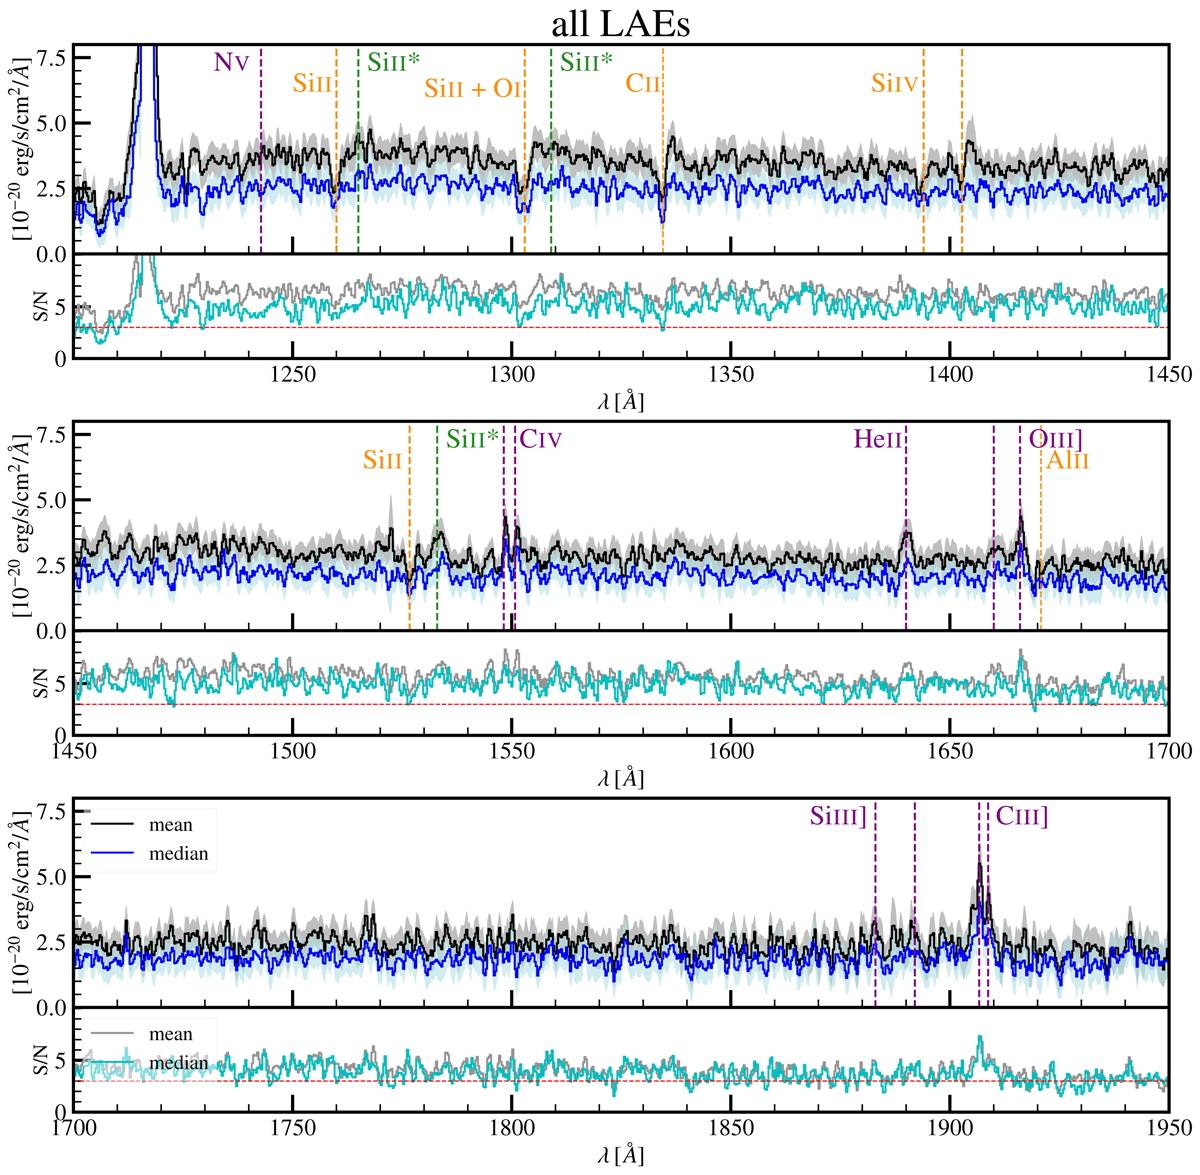
Mean and median spectra of all 220 LAEs described in Sect. 2.1 shown in black and blue with the error displayed via gray and light-blue shaded areas, respectively. The vertical lines indicate the rest-frame wavelengths of some of the main spectral features: nebular emission lines (purple), ISM absorption (orange), and fine-structure transitions (green). The bottom panels show the S/N per pixel (gray and cyan curves for mean and median spectra, respectively) with the dotted red horizontal line indicating S/N = 3.
Current usage metrics show cumulative count of Article Views (full-text article views including HTML views, PDF and ePub downloads, according to the available data) and Abstracts Views on Vision4Press platform.
Data correspond to usage on the plateform after 2015. The current usage metrics is available 48-96 hours after online publication and is updated daily on week days.
Initial download of the metrics may take a while.