Fig. 2.
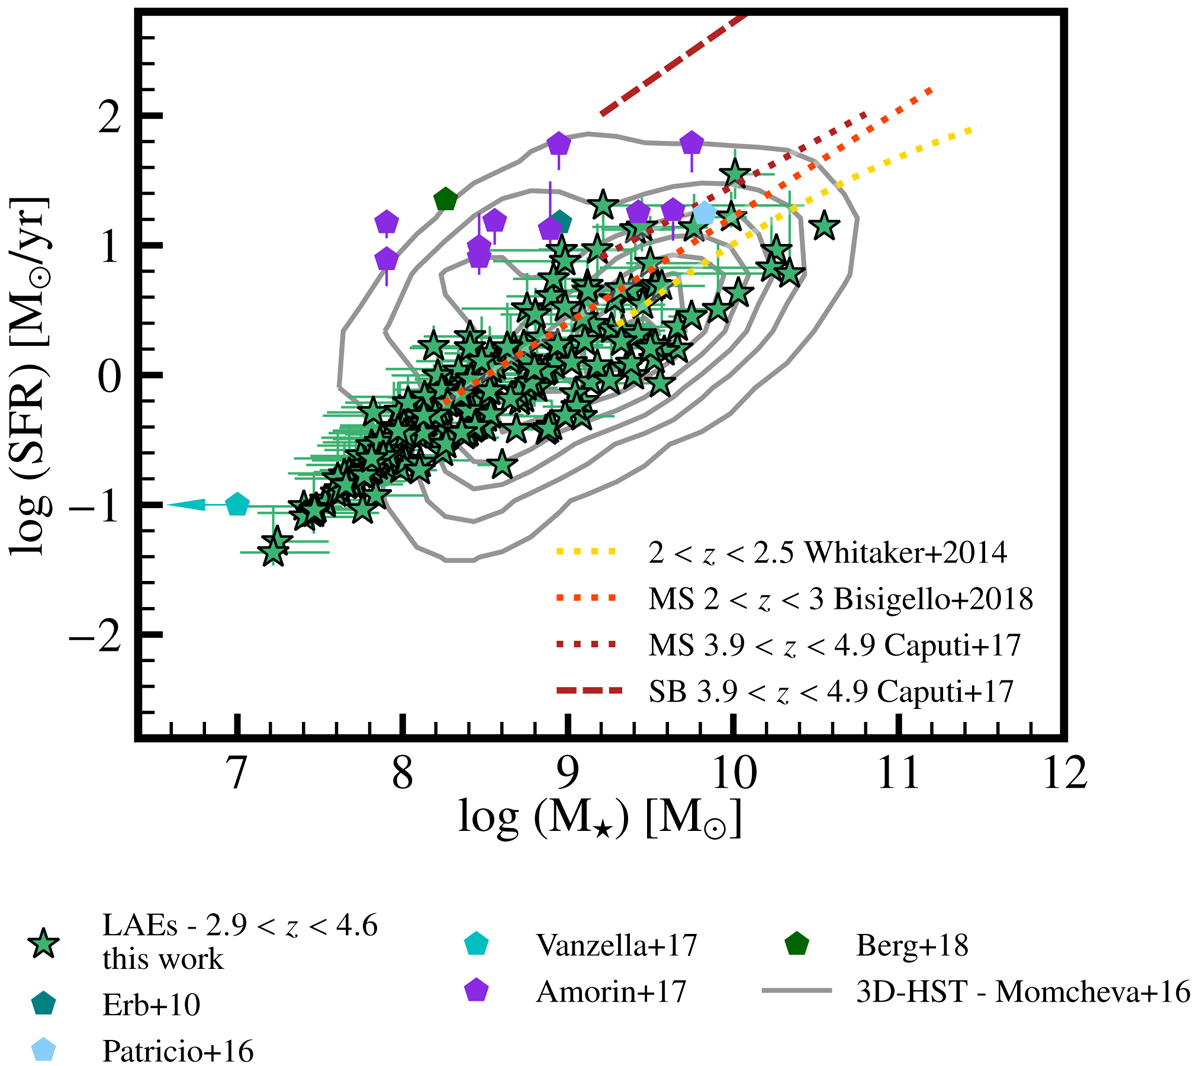
Distribution of the LAE sample (green stars) in the star formation rate-stellar mass (SFR-M⋆) plane. For comparison, values for 2.4 < z < 5.5 galaxies in the 3D-HST survey public catalog by Momcheva et al. (2016) and data for z ≳ 2 star-forming galaxies from Erb et al. (2010), Patrício et al. (2016), Amorín et al. (2017), Vanzella et al. (2017), and Berg et al. (2018) (see also Sect. 5.2) are shown color-coded as labeled in the legend. The curves of the star formation sequence from Whitaker et al. (2014) at 2 < z < 2.5, main sequence (MS) at 2 < z < 3 from Bisigello et al. (2018), and at 3.9 < z < 4.9 from Caputi et al. (2017) and the starburst (SB) sequence at 3.9 < z < 4.9 from Caputi et al. (2017) are shown for reference.
Current usage metrics show cumulative count of Article Views (full-text article views including HTML views, PDF and ePub downloads, according to the available data) and Abstracts Views on Vision4Press platform.
Data correspond to usage on the plateform after 2015. The current usage metrics is available 48-96 hours after online publication and is updated daily on week days.
Initial download of the metrics may take a while.