Fig. 1.
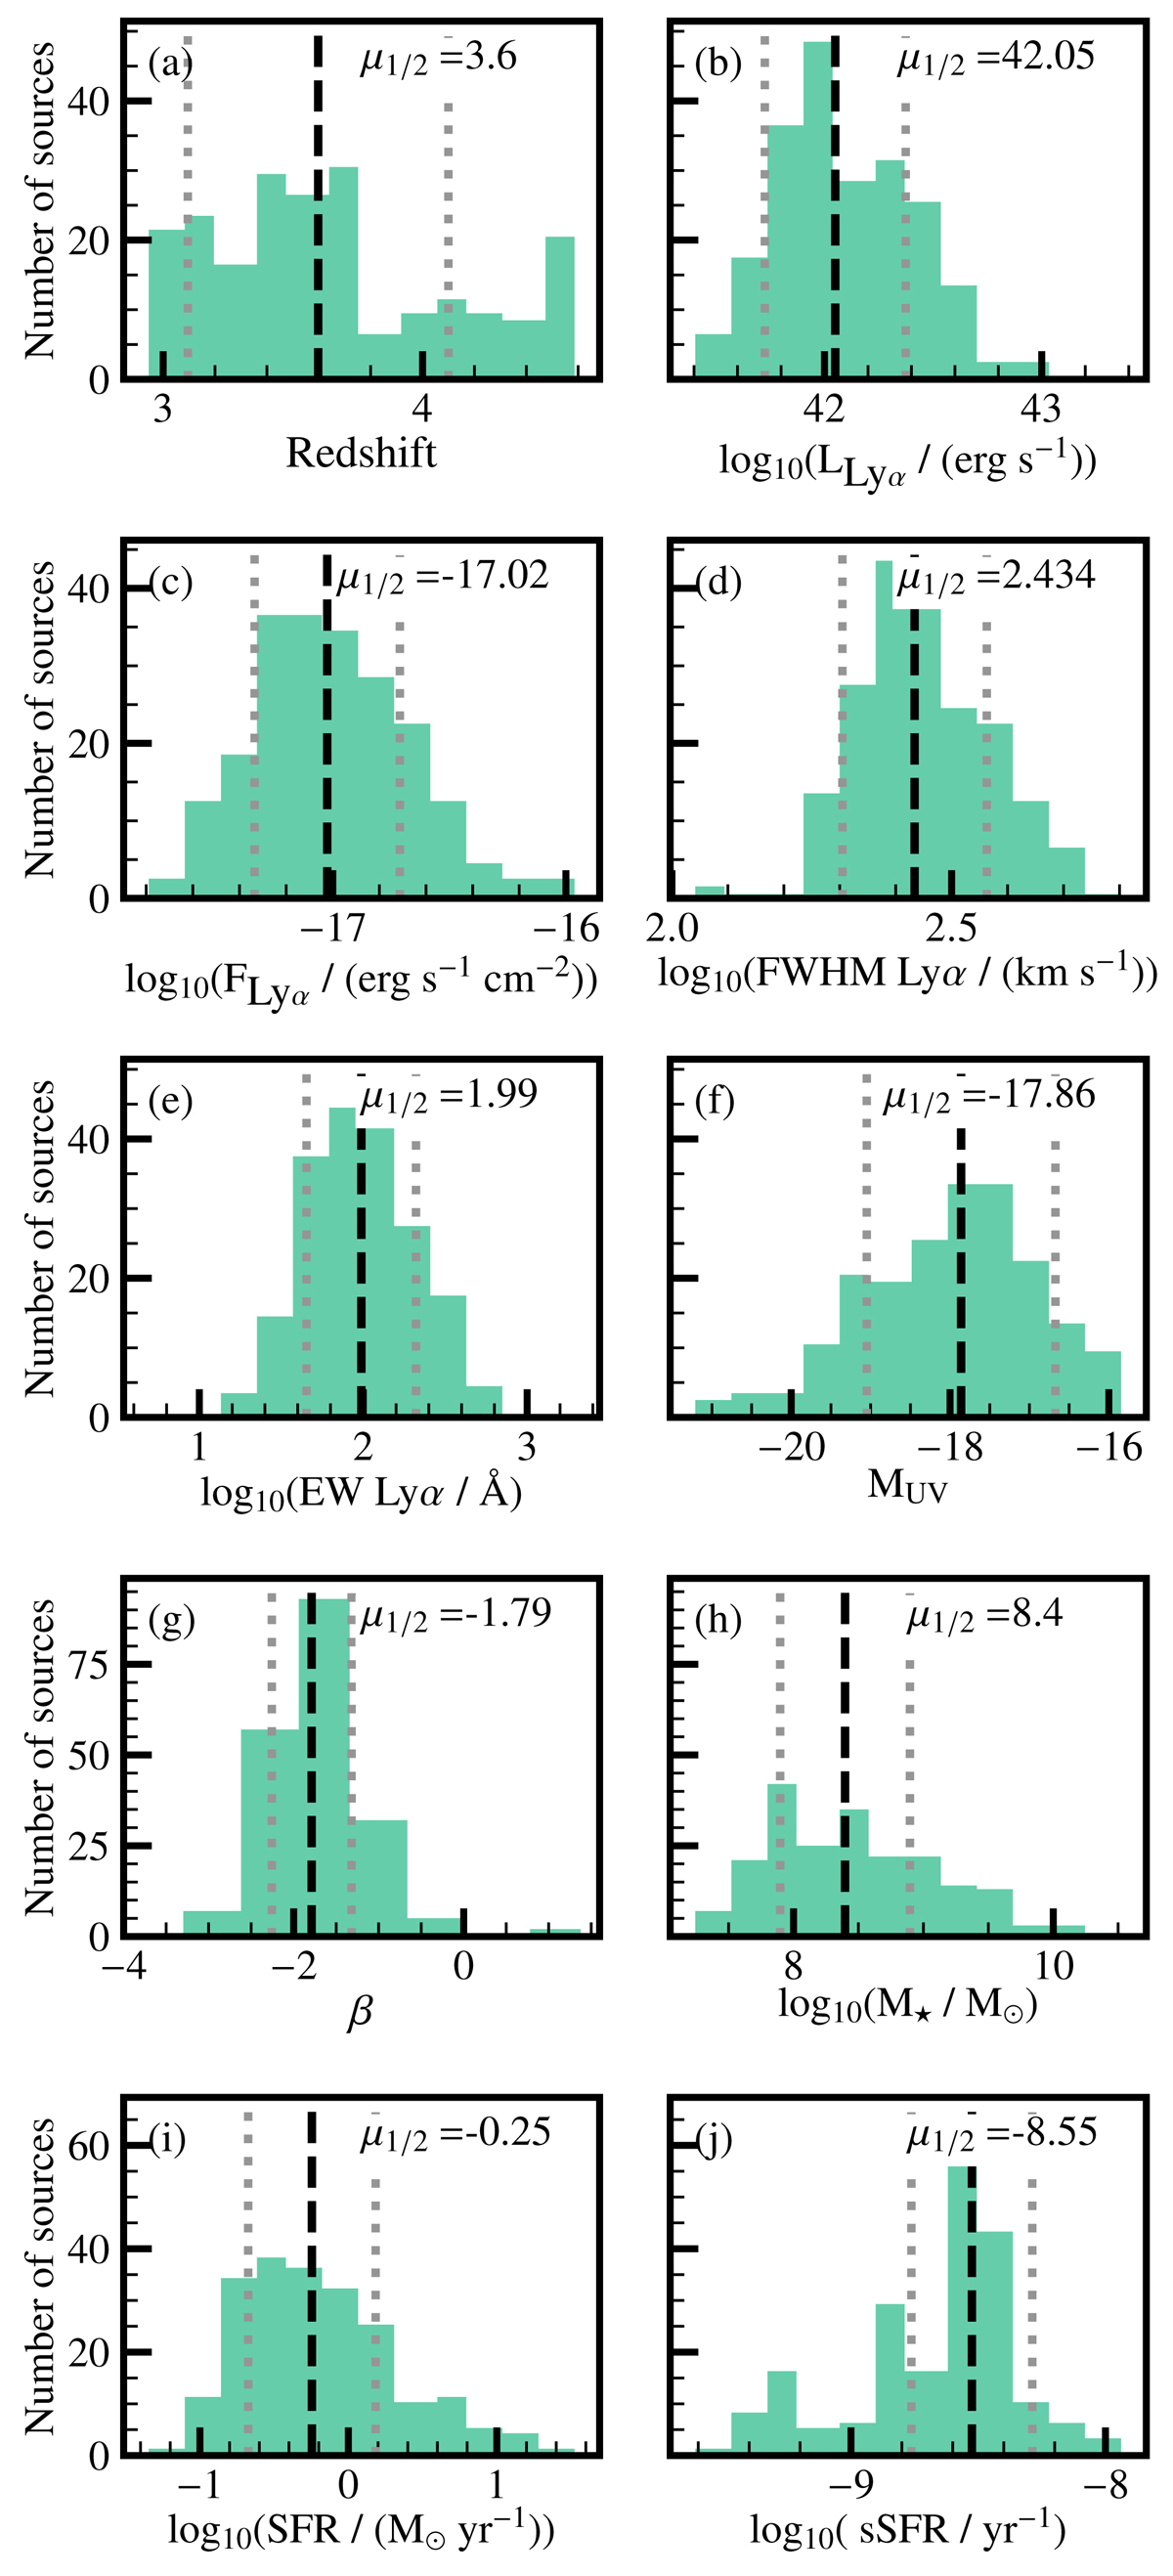
Distributions of observed and physical properties of the LAE sample described in Sect. 2.1. From panel a–j: redshift, Lyα luminosity, Lyα flux, Lyα FWHM, rest-frame Lyα EW, absolute UV magnitude, UV spectral slope, stellar mass, SFR, and sSFR. The Lyα emission shown here has not been corrected by attenuation from dust. The vertical dashed black line indicates the median value, μ1/2 (reported in the top right), of the distributions used to select the subsamples of Sect. 3.2. The vertical dotted gray lines indicate the median absolute deviation.
Current usage metrics show cumulative count of Article Views (full-text article views including HTML views, PDF and ePub downloads, according to the available data) and Abstracts Views on Vision4Press platform.
Data correspond to usage on the plateform after 2015. The current usage metrics is available 48-96 hours after online publication and is updated daily on week days.
Initial download of the metrics may take a while.