Fig. 9.
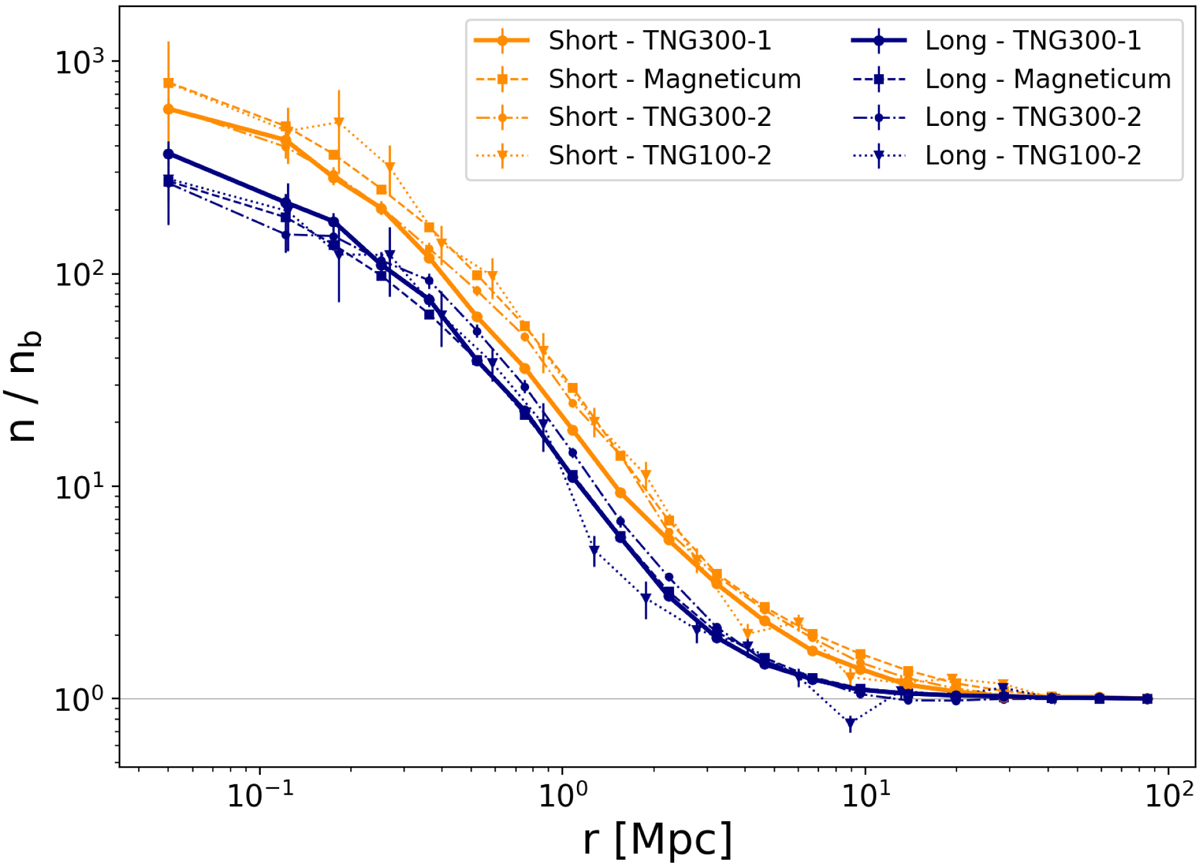
Average galaxy density profiles around short (orange curves) and long filaments (in blue) for the reference TNG300-1 simulation (thick solid lines with dots), and the Magneticum (dashed lines with squares), TNG300-2 (dotted-dashed lines with points) and TNG100-2 (dotted lines with triangles) simulations. The length limits defining short and long filaments in each simulation are presented in Table 2. For the sake of comparison, all the profiles have been rescaled by their respective background.
Current usage metrics show cumulative count of Article Views (full-text article views including HTML views, PDF and ePub downloads, according to the available data) and Abstracts Views on Vision4Press platform.
Data correspond to usage on the plateform after 2015. The current usage metrics is available 48-96 hours after online publication and is updated daily on week days.
Initial download of the metrics may take a while.