Fig. 8.
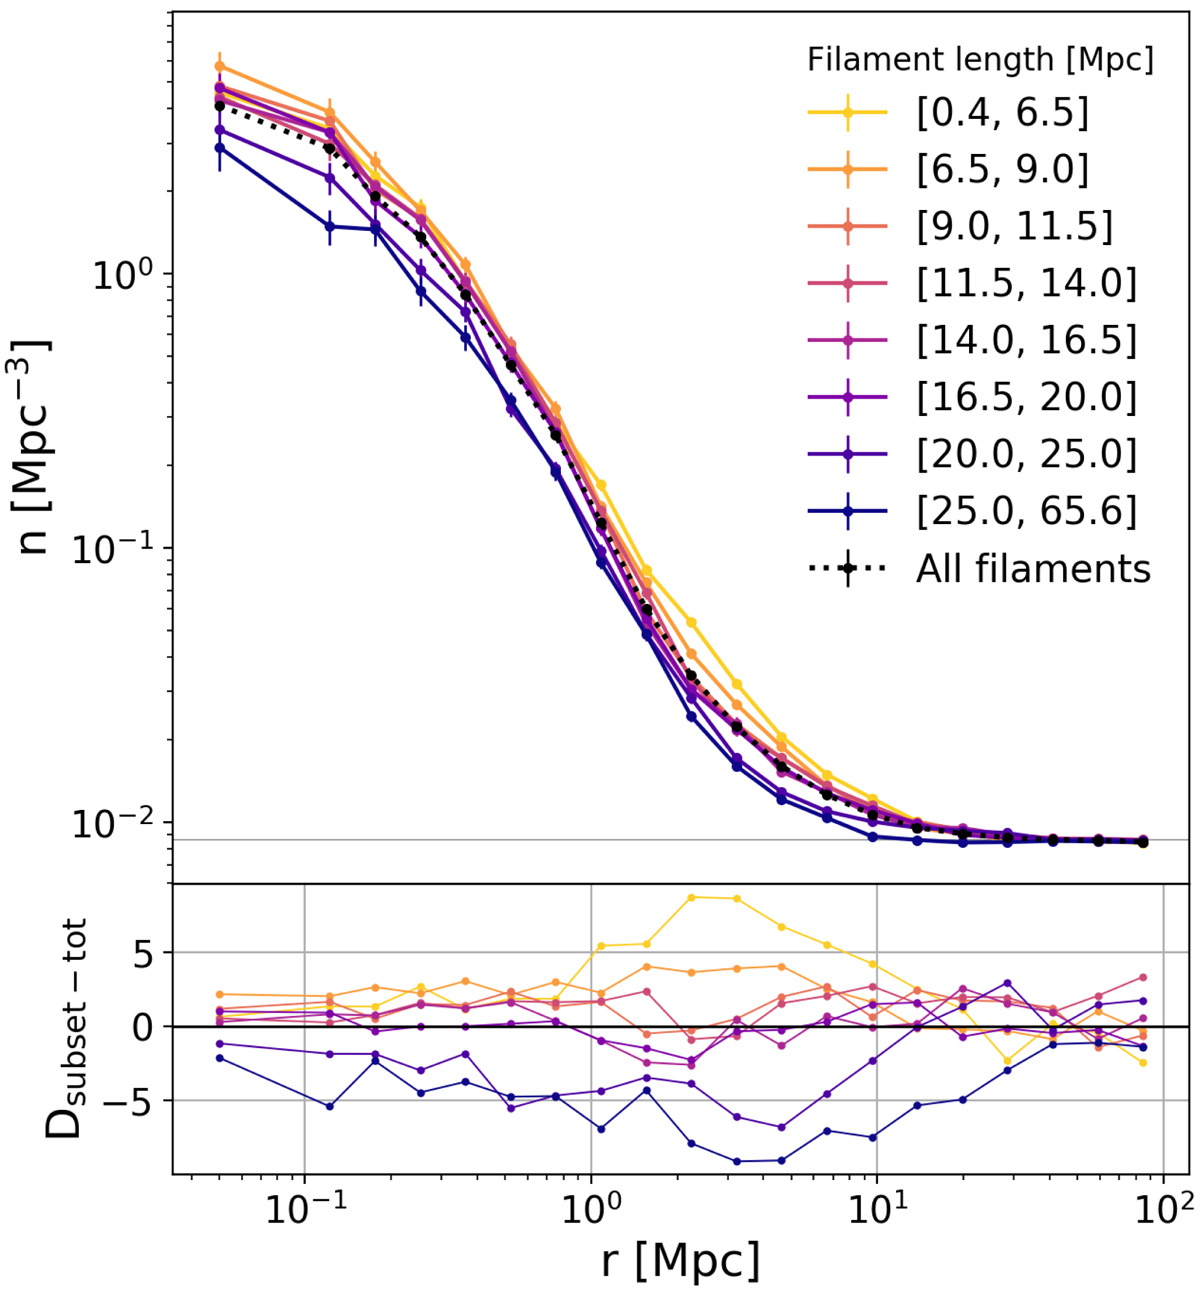
Top: radial galaxy density profiles of filaments by bins of filament length for the reference catalogue (TNG300-1). The black curve corresponds to the average of all the filaments, regardless of their length, as presented in Sect. 4.1. The coloured curves correspond to the average of length-selected filaments. The gray horizontal line represents the background galaxy density of the simulation box. Bottom: deviation from the mean Dsubset − tot of the length-selected profiles (see definition in Eq. (2)).
Current usage metrics show cumulative count of Article Views (full-text article views including HTML views, PDF and ePub downloads, according to the available data) and Abstracts Views on Vision4Press platform.
Data correspond to usage on the plateform after 2015. The current usage metrics is available 48-96 hours after online publication and is updated daily on week days.
Initial download of the metrics may take a while.