Fig. 7.
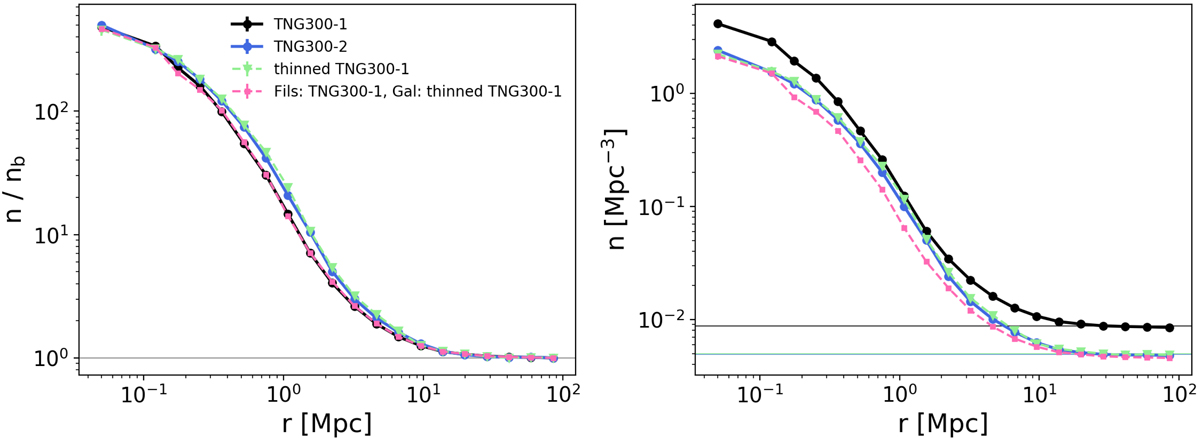
Study of resolution effects in the density profiles (see Sect. 4.1). The black and blue curves present the galaxy density profiles of the TNG300-1 and TNG300-2 simulations, as presented in Fig. 6. The green dashed curve with triangles corresponds to the density profiles of the thinned TNG300-1 galaxy catalogue around and the corresponding DisPerSE filaments (see text in Sect. 4.1). The pink dashed profile with squares represents the density of the thinned TNG300-1 galaxy catalogue around the reference TNG300-1 original skeleton. Left: rescaled density profiles. Right: density profiles at their respective galaxy backgrounds.
Current usage metrics show cumulative count of Article Views (full-text article views including HTML views, PDF and ePub downloads, according to the available data) and Abstracts Views on Vision4Press platform.
Data correspond to usage on the plateform after 2015. The current usage metrics is available 48-96 hours after online publication and is updated daily on week days.
Initial download of the metrics may take a while.