Fig. 6.
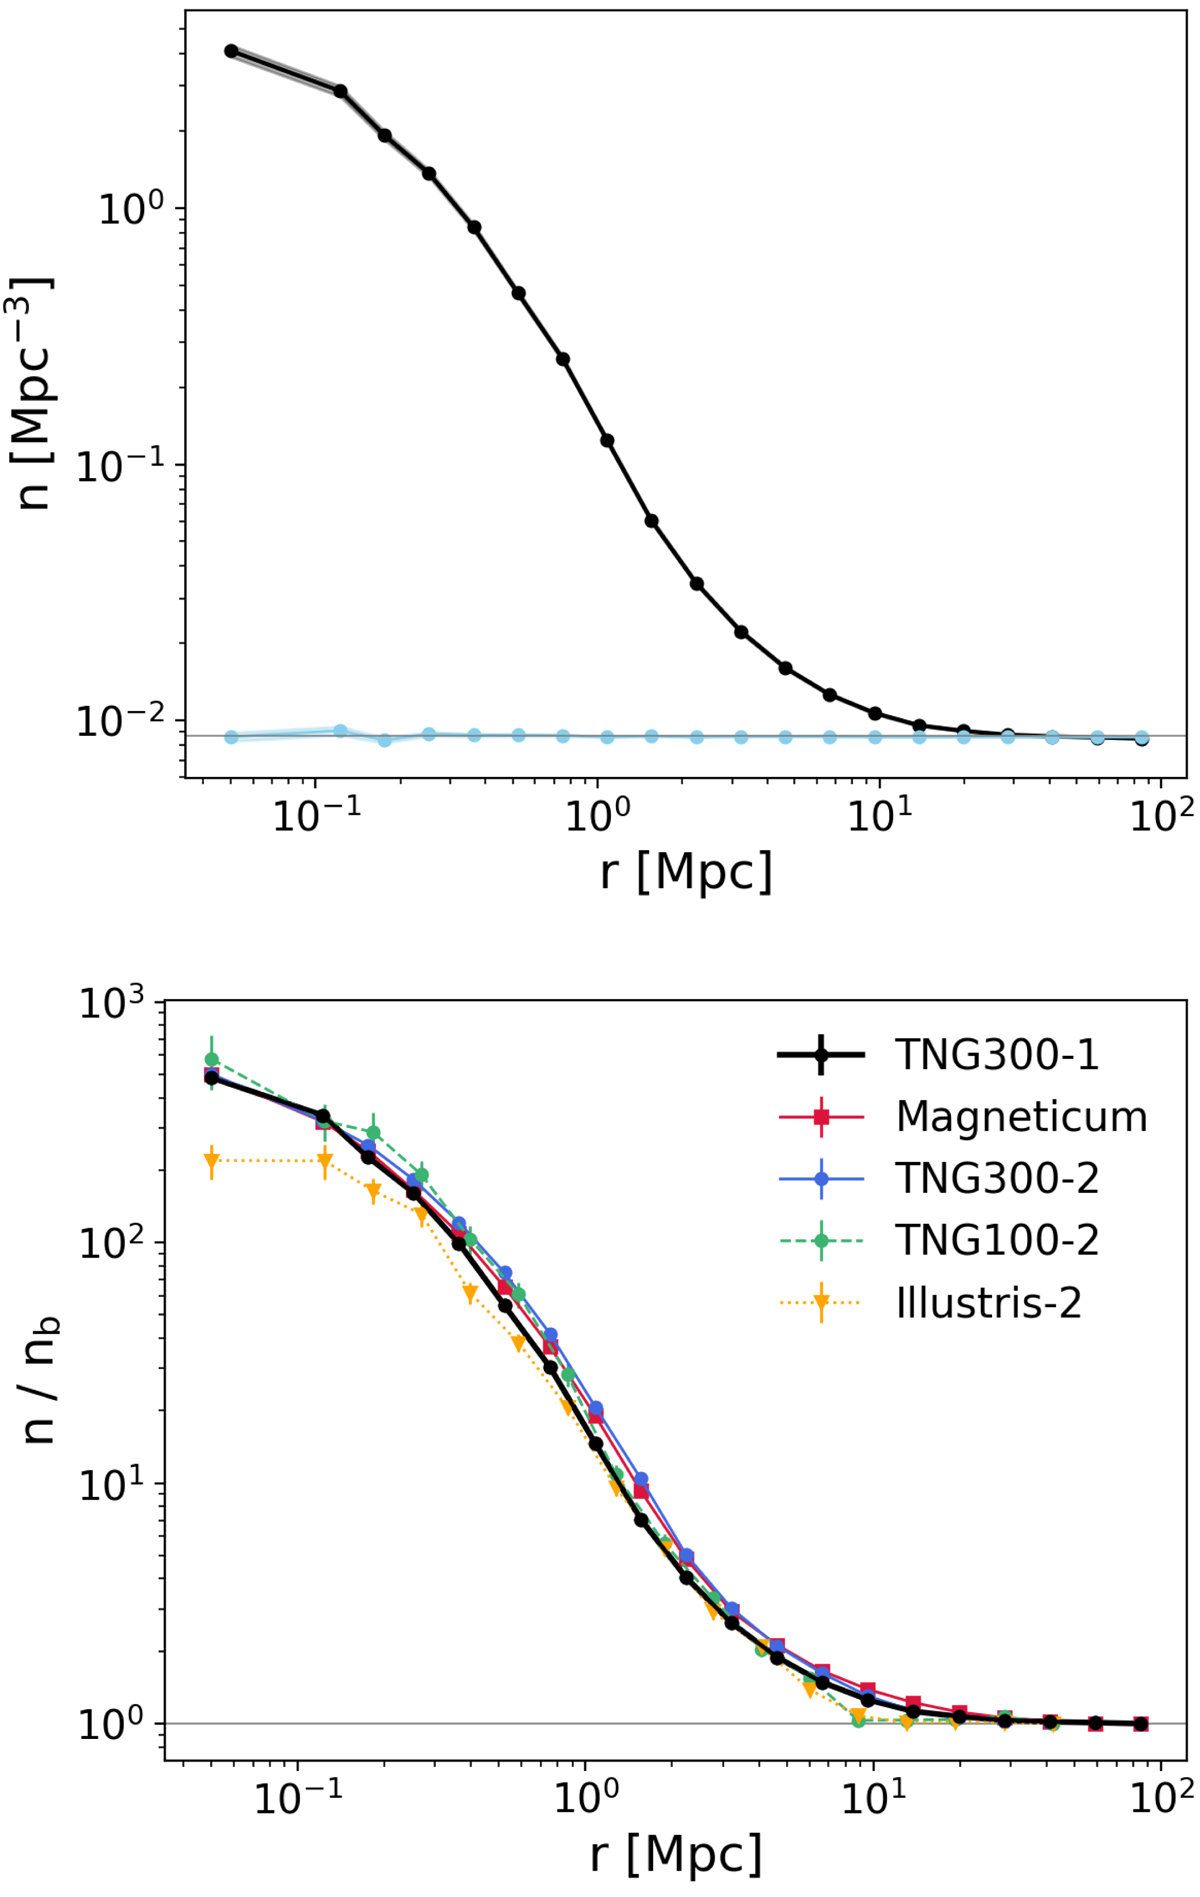
Top: radial density profile of galaxies around filaments of the reference catalogue (TNG300-1). The black curve shows the average galaxy density of all filaments. The blue curve presents the null-test, which is obtained by computing the density of galaxies around randomly shifted filament positions (see Sect. 4.1). The gray horizontal line represents the mean galaxy density of the simulation box. Bottom: radial density profile of filaments of the TNG300-1 (black curve), Magneticum (red), TNG300-2 (blue), TNG100-2 (green) and Illustris-2 catalogues (yellow curve). For the sake of comparison, the profiles have been rescaled by their background densities.
Current usage metrics show cumulative count of Article Views (full-text article views including HTML views, PDF and ePub downloads, according to the available data) and Abstracts Views on Vision4Press platform.
Data correspond to usage on the plateform after 2015. The current usage metrics is available 48-96 hours after online publication and is updated daily on week days.
Initial download of the metrics may take a while.