Fig. 5.
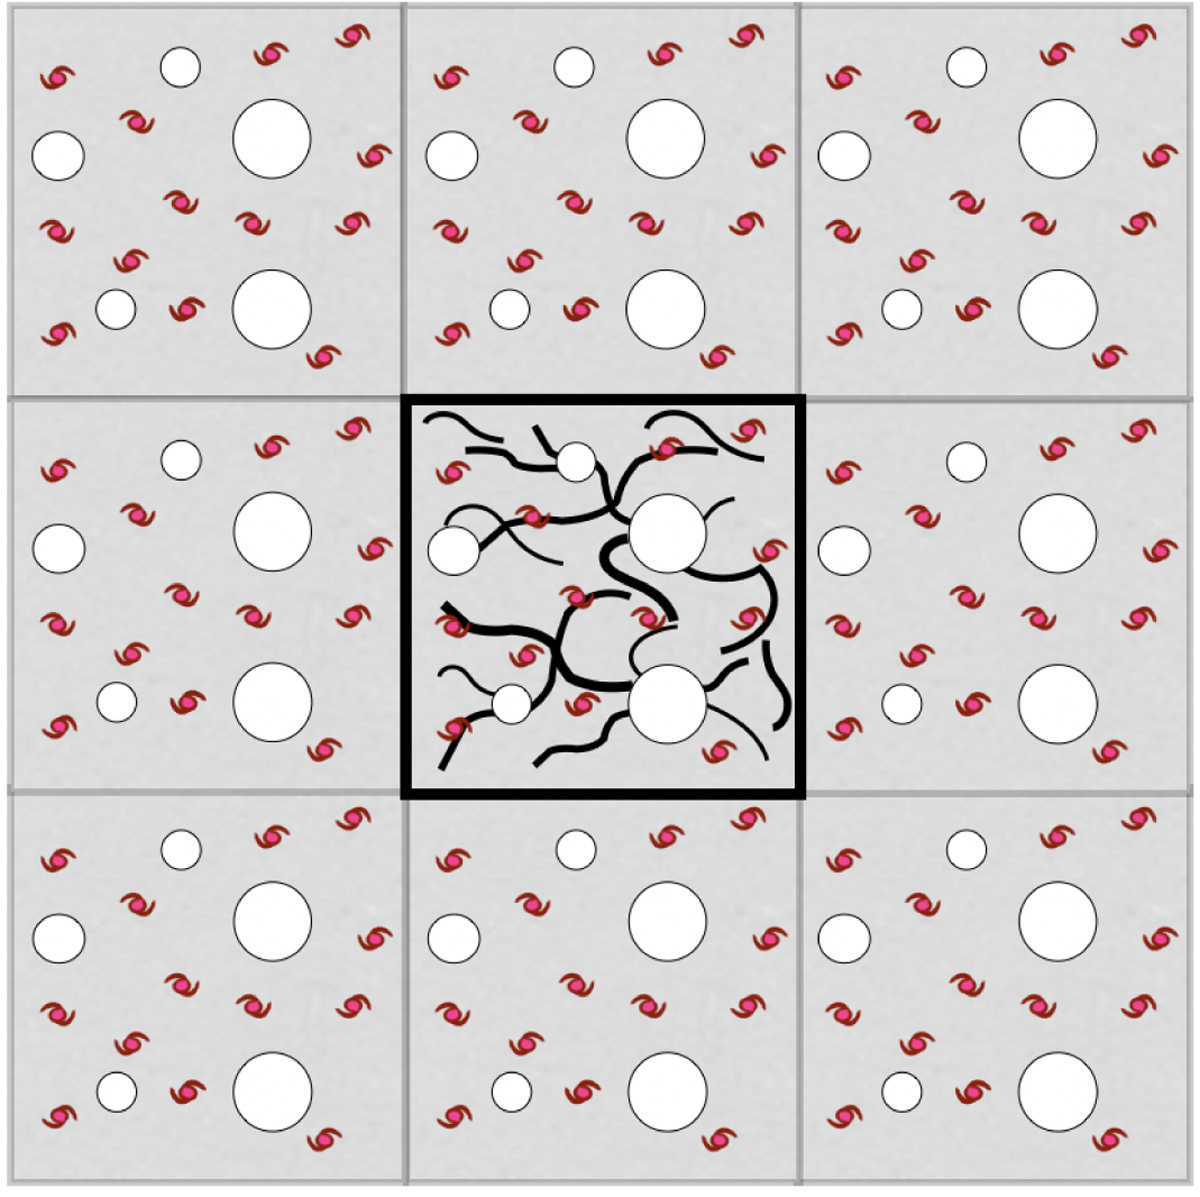
Illustration in 2D of the central volume and the replicated boxes. The galaxy distribution is replicated at the borders of the central volume where the filaments are defined. This is done with the aim of reducing the effects of a volume-limited box in the density profiles. The white circles correspond to the masked regions (see Sect. 3.3).
Current usage metrics show cumulative count of Article Views (full-text article views including HTML views, PDF and ePub downloads, according to the available data) and Abstracts Views on Vision4Press platform.
Data correspond to usage on the plateform after 2015. The current usage metrics is available 48-96 hours after online publication and is updated daily on week days.
Initial download of the metrics may take a while.