Fig. 2.
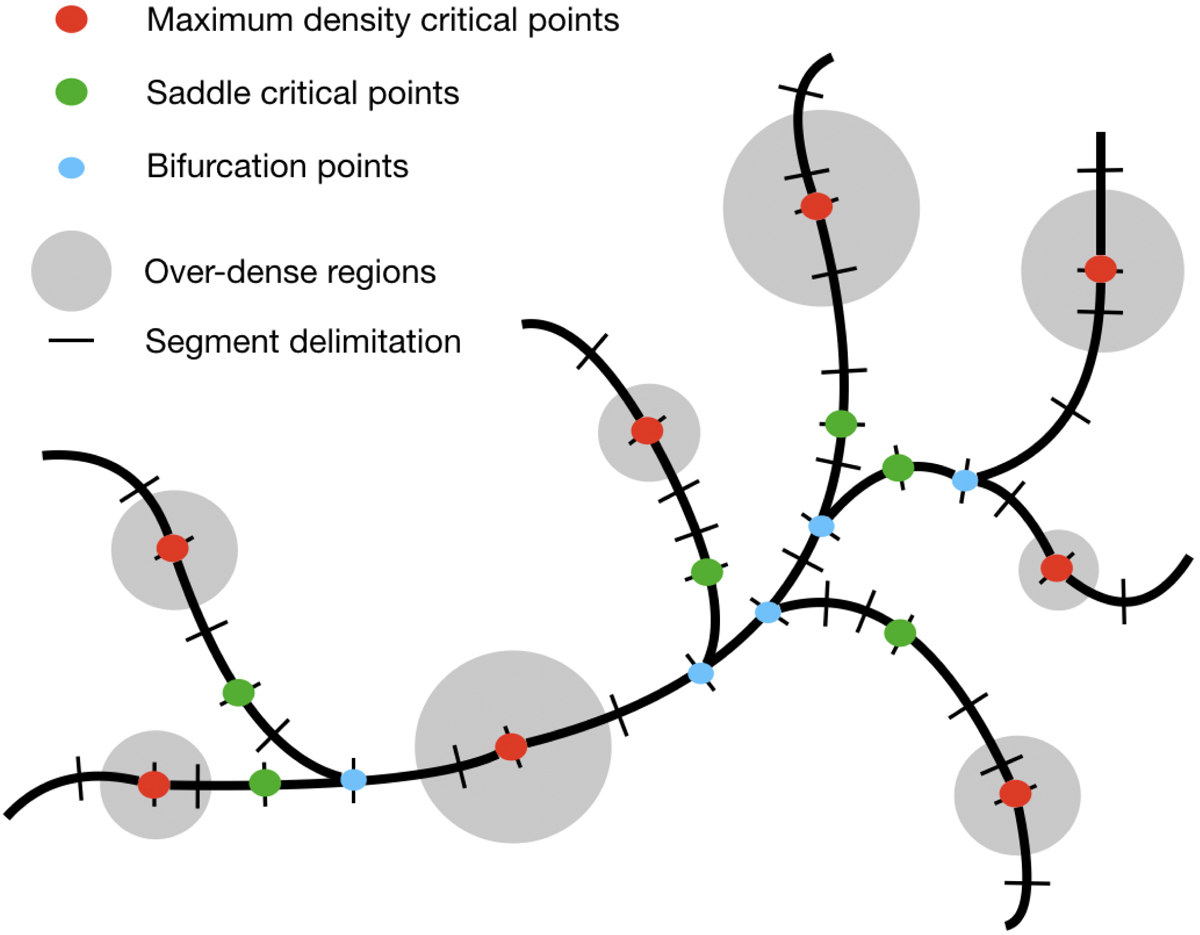
Illustration of the 3D DisPerSE skeleton projected on a 2D plane. Segments of filaments (thick black lines) are organised into portions delimited by critical points (in red, green and blue respectively for maxima, saddles and bifurcations). Maximum density critical points are located in over-dense regions (represented by grey discs) identified from the Delaunay density field. This illustration shows a total of 44 segments, organized in 18 portions forming 13 filaments, defined as the sets of segments connecting maxima to saddles.
Current usage metrics show cumulative count of Article Views (full-text article views including HTML views, PDF and ePub downloads, according to the available data) and Abstracts Views on Vision4Press platform.
Data correspond to usage on the plateform after 2015. The current usage metrics is available 48-96 hours after online publication and is updated daily on week days.
Initial download of the metrics may take a while.