Fig. A.1.
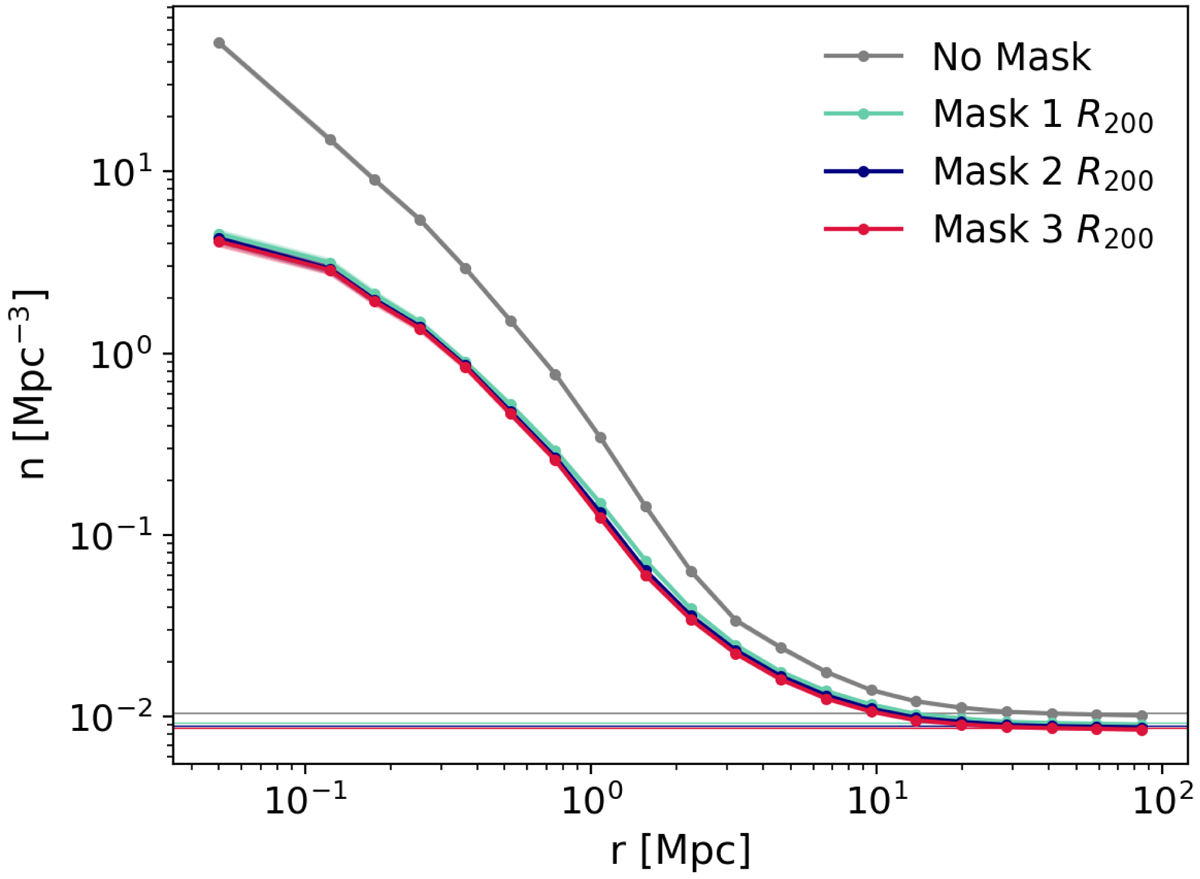
Density profiles of galaxies around filaments with different masks of the maximum density critical points: 1 × R200 (green), 2 × R200 (blue) and 3 × R200 (pink). The gray curve represents the density profile without applying any mask. The horizontal thin lines represent the corresponding background galaxy densities after removing the masked galaxies.
Current usage metrics show cumulative count of Article Views (full-text article views including HTML views, PDF and ePub downloads, according to the available data) and Abstracts Views on Vision4Press platform.
Data correspond to usage on the plateform after 2015. The current usage metrics is available 48-96 hours after online publication and is updated daily on week days.
Initial download of the metrics may take a while.