Fig. 14.
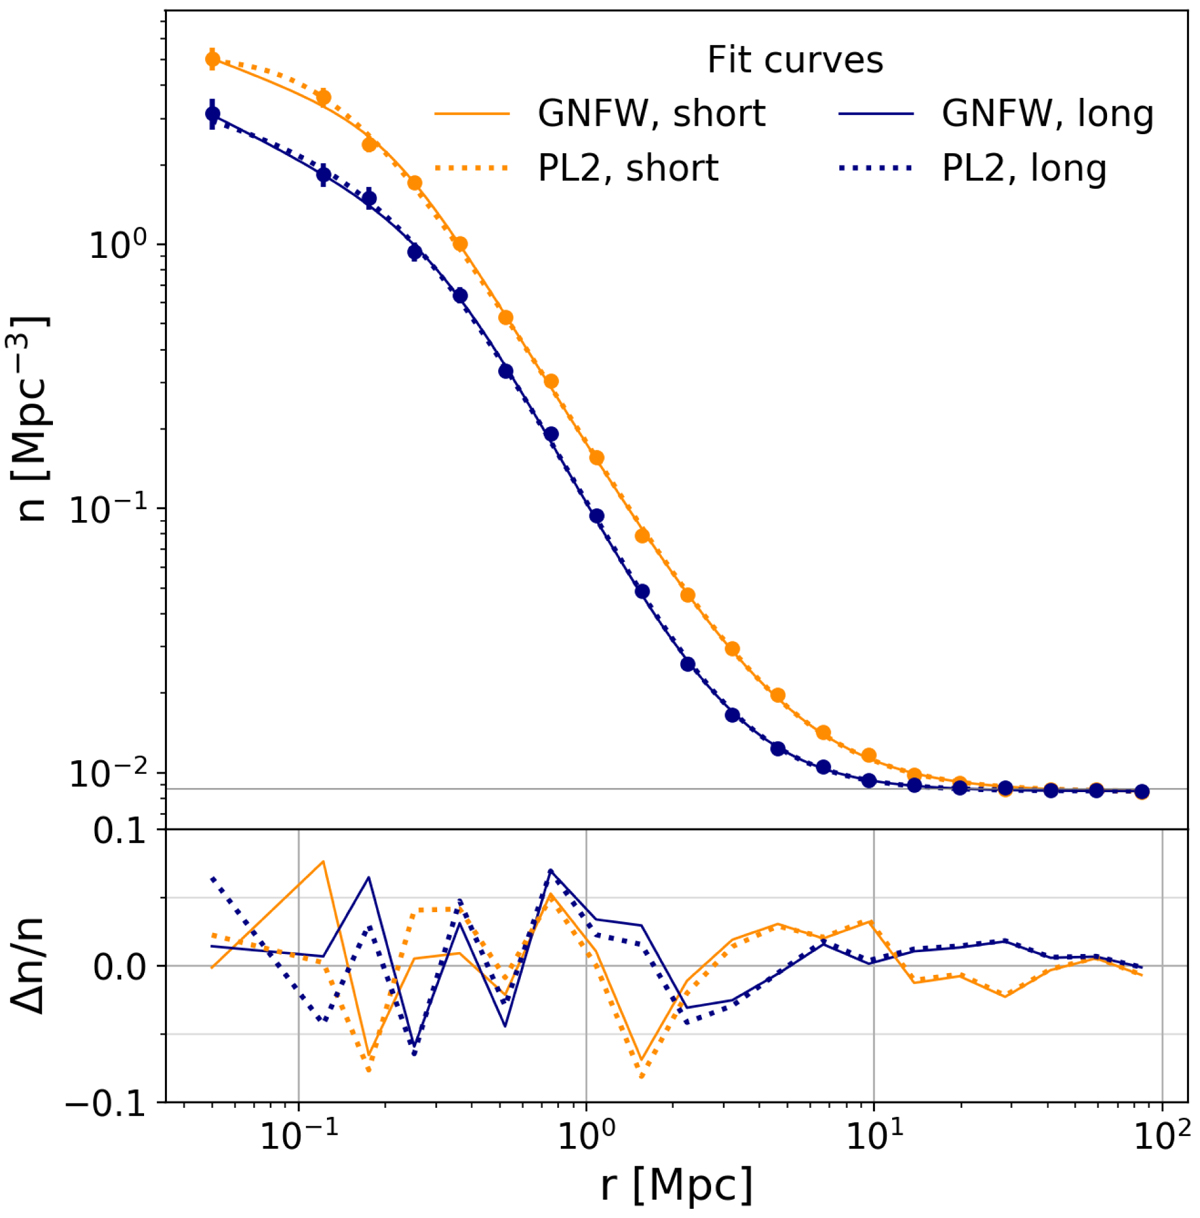
Top: fit-curves of short (orange) and long (blue) filaments. Solid and dashed lines correspond respectively to the GNFW (Eq. (4)) and the double power law (Eq. (7)) models. The fit curves are plotted using the parameters of Tables 3 and 4. Bottom: relative difference of the fits with respect to the data, defined as: Δn/n(r) = [ndata(r)−nmodel(r)]/ndata(r).
Current usage metrics show cumulative count of Article Views (full-text article views including HTML views, PDF and ePub downloads, according to the available data) and Abstracts Views on Vision4Press platform.
Data correspond to usage on the plateform after 2015. The current usage metrics is available 48-96 hours after online publication and is updated daily on week days.
Initial download of the metrics may take a while.