Open Access
Fig. 10.
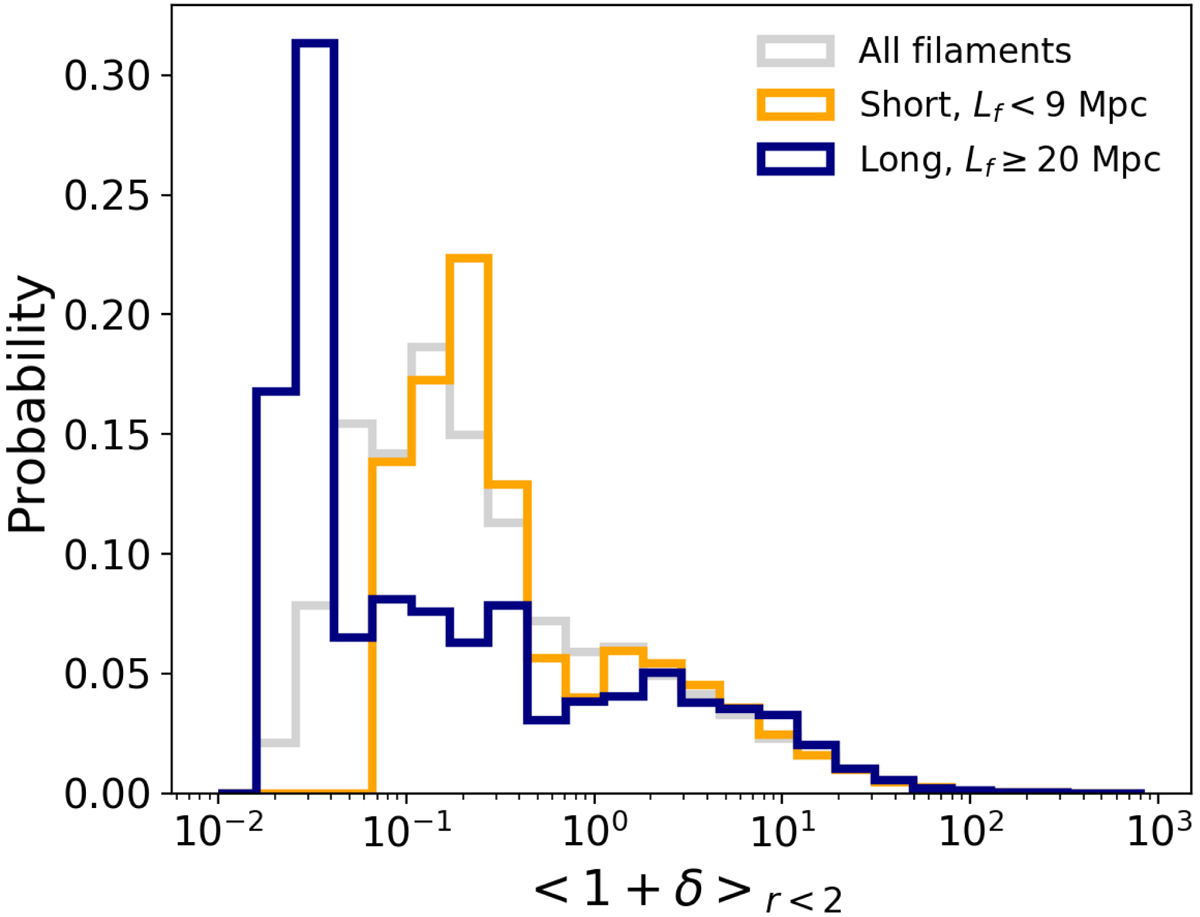
Probability distributions of the excess of density ⟨1 + δ⟩r < 2 (see Eq. (3)) of short (orange), long (blue) and the total population of filaments (gray). This quantity corresponds to the excess of density of a filament with respect to the background density, averaged up to a radial distance of R = 2 Mpc.
Current usage metrics show cumulative count of Article Views (full-text article views including HTML views, PDF and ePub downloads, according to the available data) and Abstracts Views on Vision4Press platform.
Data correspond to usage on the plateform after 2015. The current usage metrics is available 48-96 hours after online publication and is updated daily on week days.
Initial download of the metrics may take a while.