Fig. 1.
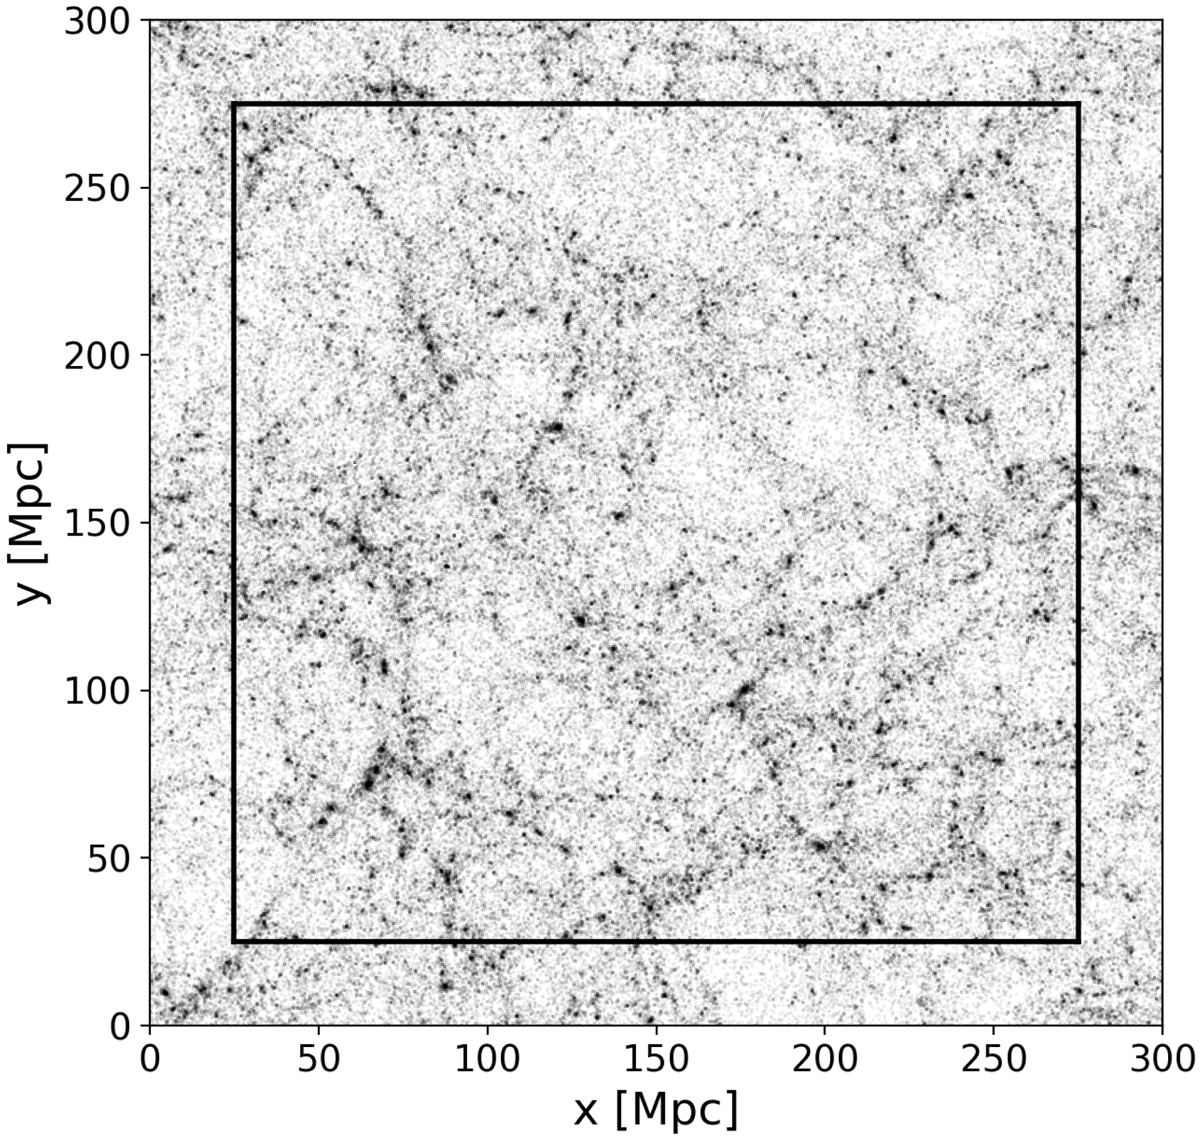
Galaxies (subhalos) of the TNG300-1 simulation box after applying the selection described in Sect. 2.2. These galaxies have stellar masses in the range 109 ≤ M*[M⊙] ≤ 1012 and constitute our reference catalogue. The full 3D box has been projected onto the xy plane. The black square represents the boundaries of the central volume of [250 Mpc]3 considered for the analysis (see Sect. 3.2).
Current usage metrics show cumulative count of Article Views (full-text article views including HTML views, PDF and ePub downloads, according to the available data) and Abstracts Views on Vision4Press platform.
Data correspond to usage on the plateform after 2015. The current usage metrics is available 48-96 hours after online publication and is updated daily on week days.
Initial download of the metrics may take a while.