Fig. 9.
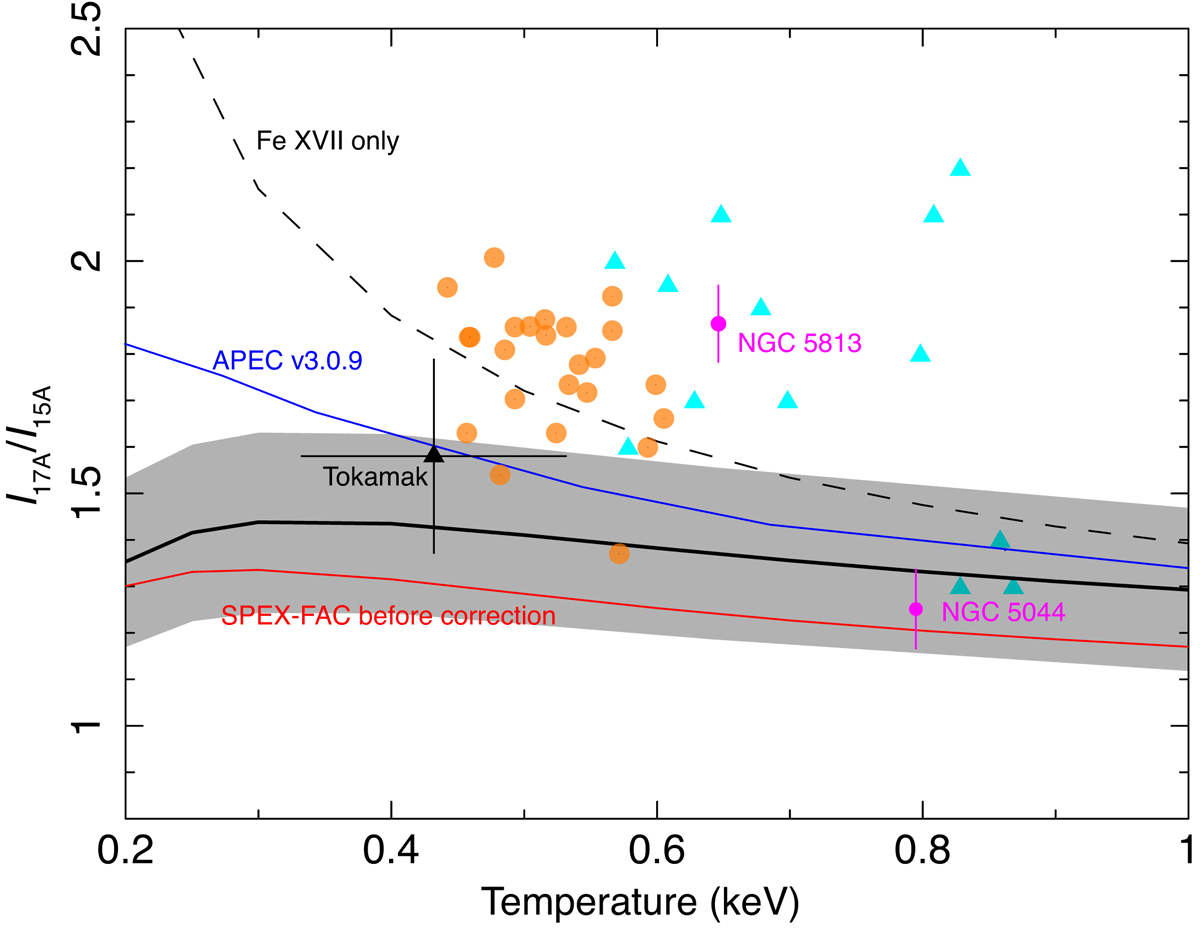
Observed and calculated values of the 17 Å-to-15 Å line ratio as a function of temperature. The SPEX model calibrated by the EBIT data is plotted by a thick black solid line, and the uncertainty is shown by the grey band. The original SPEX-FAC calculation, the APEC v3.09, and the calibrated ratio with Ne-like Fe only are shown by the red solid, blue solid, and black dashed lines. The black triangle shows the laboratory measurement result taken from Beiersdorfer et al. (2004), and the magenta data points are the astrophysical measurements of elliptical galaxies taken from de Plaa et al. (2012). For NGC 5813, the deviation from the model curve is caused by the resonant scattering in the interstellar medium. The line ratios measured from the Chandra High-Energy Transmission Grating data of a sample of stellar coronae (Gu 2009) are shown in orange, and those measured with the XMM-Newton Reflection Grating Spectrometer for a sample of galaxies (Ogorzalek et al. 2017) are shown in cyan.
Current usage metrics show cumulative count of Article Views (full-text article views including HTML views, PDF and ePub downloads, according to the available data) and Abstracts Views on Vision4Press platform.
Data correspond to usage on the plateform after 2015. The current usage metrics is available 48-96 hours after online publication and is updated daily on week days.
Initial download of the metrics may take a while.