Fig. 4.
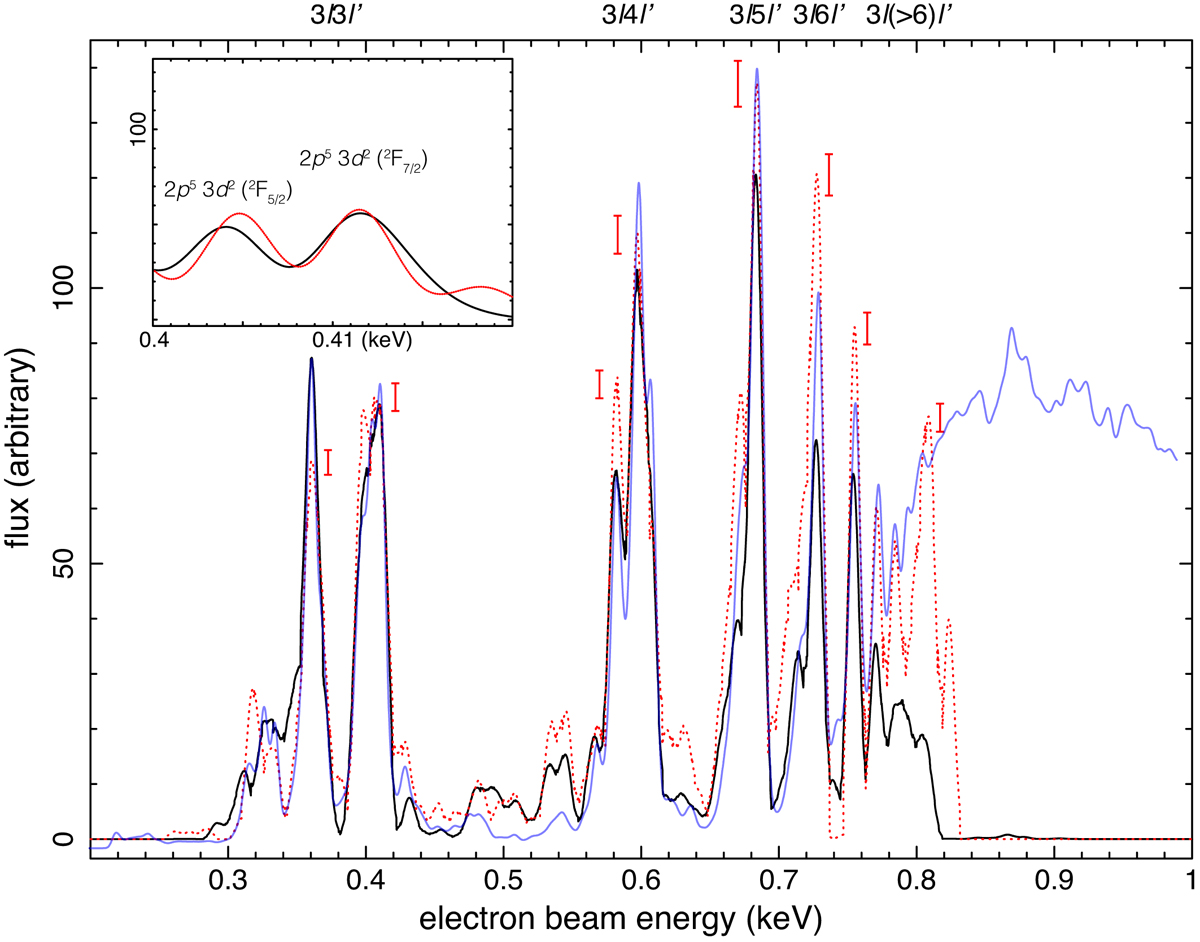
Dielectronic recombination line intensities as a function of electron beam energy. The original SPEX model and the EBIT data are shown in black and red, respectively. Data uncertainties on the strong lines are marked as error bars alongside the peaks. Inset: normalization of the data and model at 2p53d2 (2F7/2). The resolutions of the spectra are 4 eV in the main plot, and 2 eV in the inset. For a comparison, the dielectronic recombination + direct excitation intensities reported in S19 are plotted in blue. The S19 data were extracted from a region of interest, with a width of 60 eV and centered on the 3d−2p transition energy. We convolve the S19 data with a Maxwellian beam energy distribution at 0.5 keV, and normalize the data to our curve shown in red at 2p53d2 (2F7/2). Direct excitation becomes gradually dominant at beam energy ≥0.8 keV in the S19 curve.
Current usage metrics show cumulative count of Article Views (full-text article views including HTML views, PDF and ePub downloads, according to the available data) and Abstracts Views on Vision4Press platform.
Data correspond to usage on the plateform after 2015. The current usage metrics is available 48-96 hours after online publication and is updated daily on week days.
Initial download of the metrics may take a while.