Fig. 3.
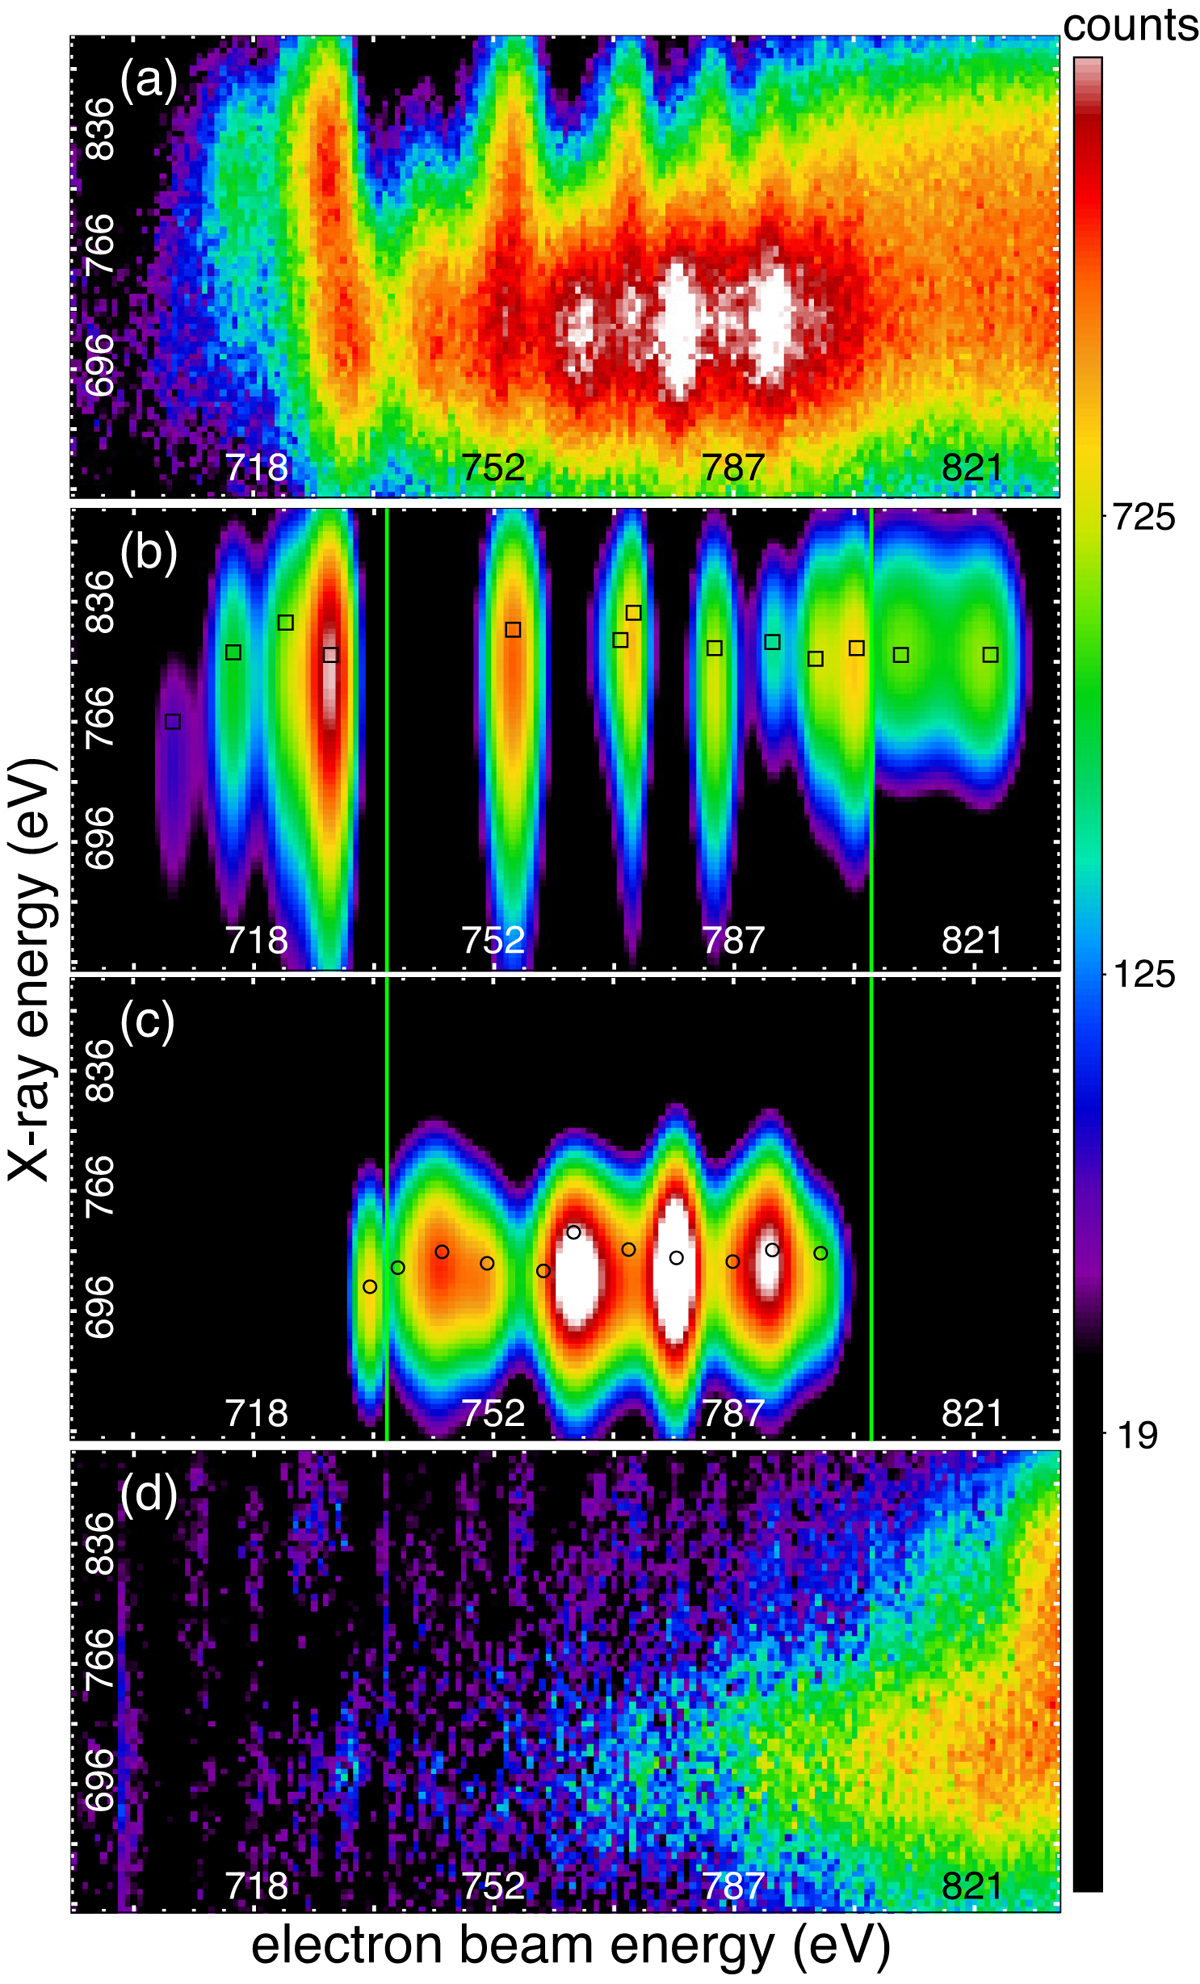
(a) EBIT data of the complex region (labeled “DR + RE complex” in Fig. 1). (b) Model of dielectronic recombination, the central positions are marked by black boxes. The boundaries of the fit windows are shown by green lines. (c) Model of resonant excitation, the central positions are marked by black circles. (d) Background noise, residual of the fit, and the direct excitation continuum.
Current usage metrics show cumulative count of Article Views (full-text article views including HTML views, PDF and ePub downloads, according to the available data) and Abstracts Views on Vision4Press platform.
Data correspond to usage on the plateform after 2015. The current usage metrics is available 48-96 hours after online publication and is updated daily on week days.
Initial download of the metrics may take a while.