Free Access
Fig. 2.
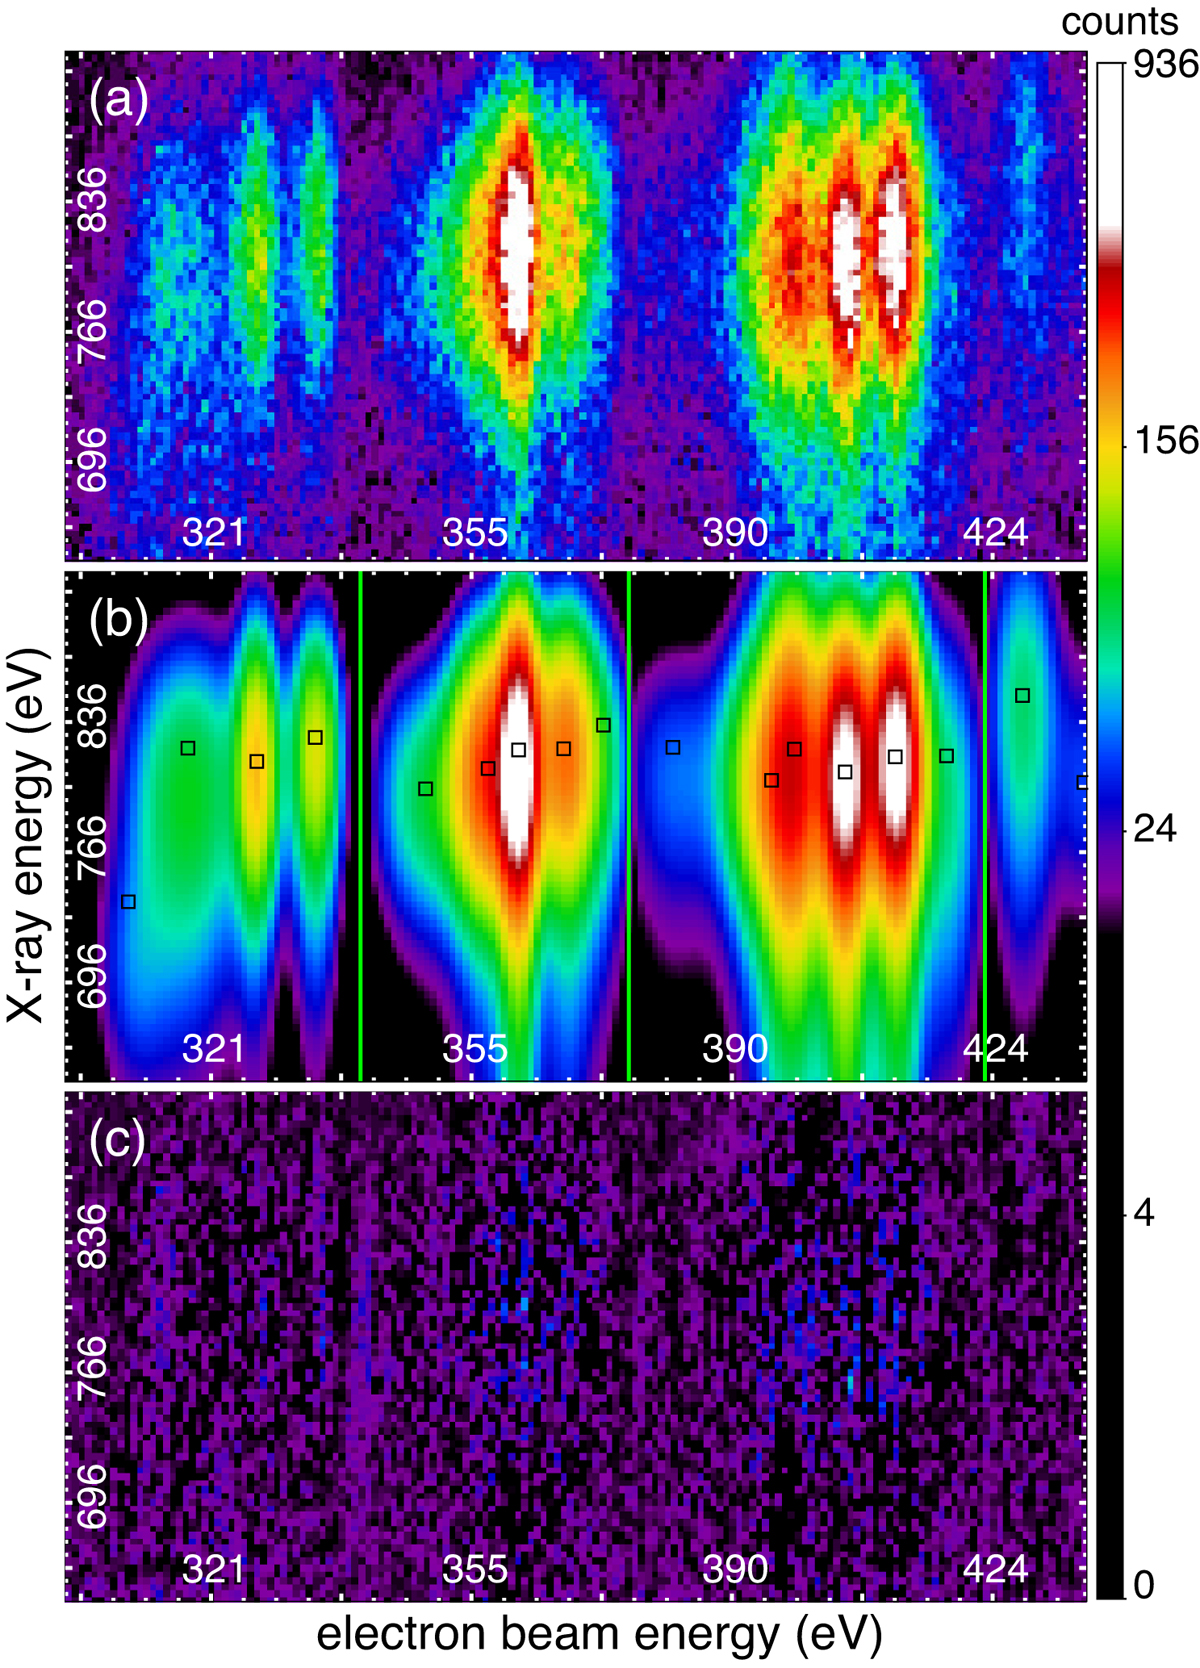
(a) EBIT data of the dielectronic recombination from 3l3l′ states (where two electrons are excited to n = 3). (b) Best-fit model, the central position of each peak is marked by a black box. The boundaries of the regions of interest are shown by green lines. (c) Background noise and residual of the fit.
Current usage metrics show cumulative count of Article Views (full-text article views including HTML views, PDF and ePub downloads, according to the available data) and Abstracts Views on Vision4Press platform.
Data correspond to usage on the plateform after 2015. The current usage metrics is available 48-96 hours after online publication and is updated daily on week days.
Initial download of the metrics may take a while.