Fig. 13.
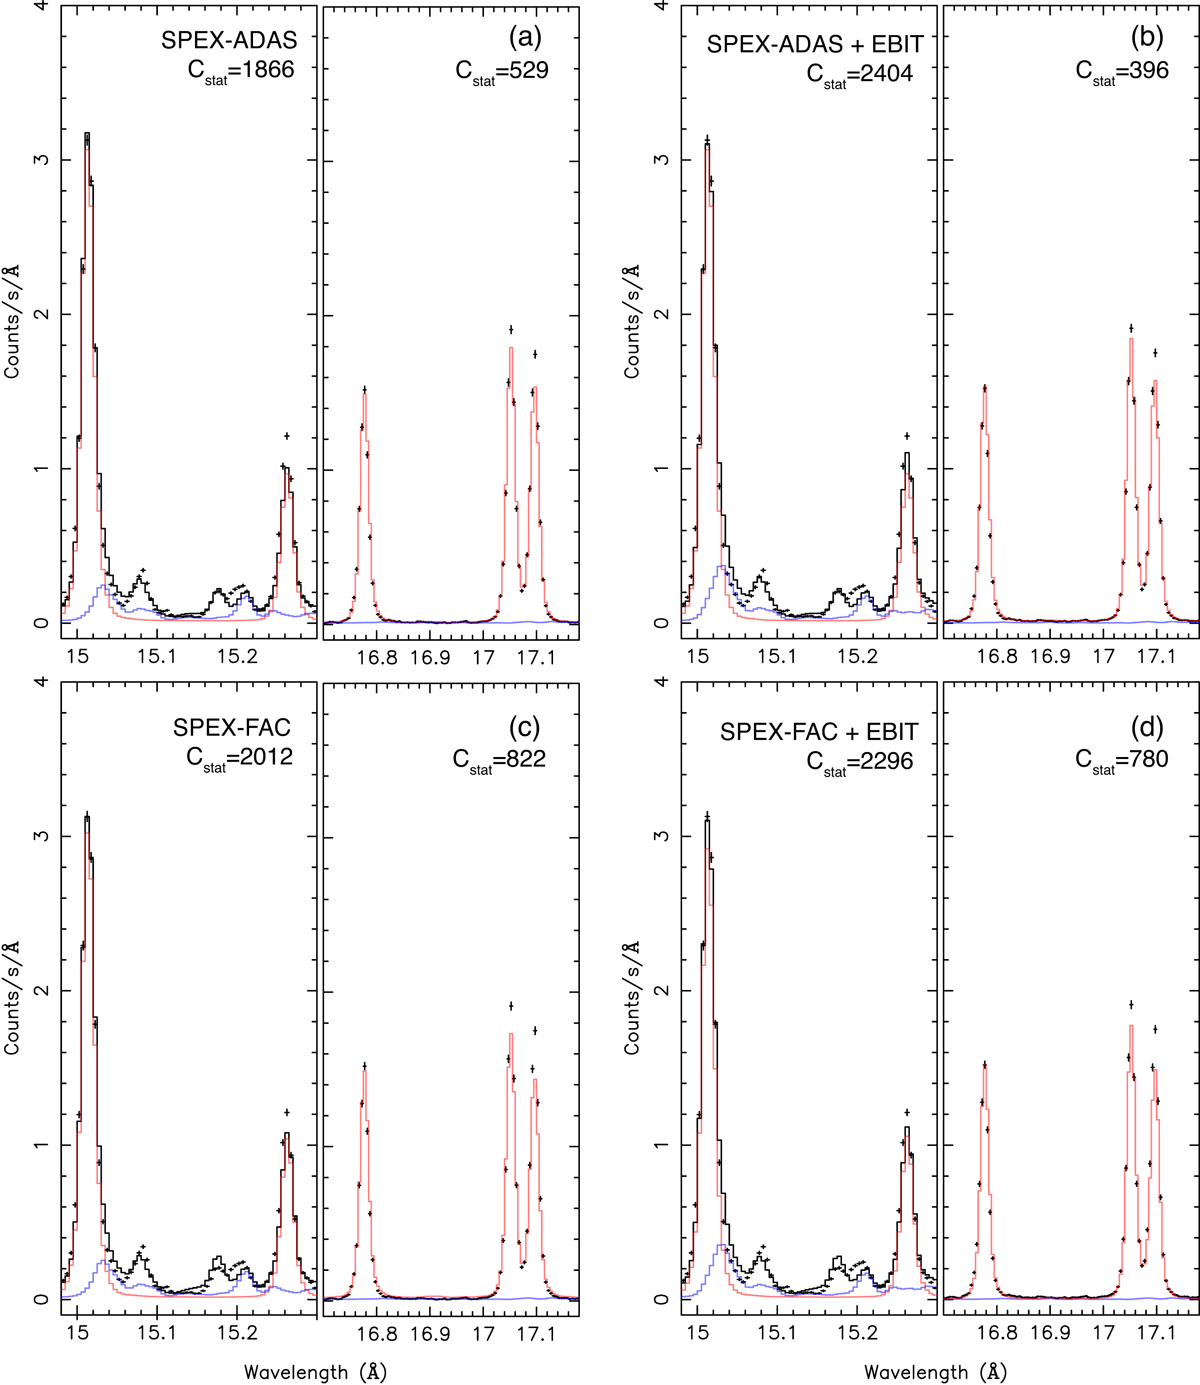
Advanced fits shown in the wavelength ranges of 14.98−15.3 Å and 16.7−17.18 Å. The fits with SPEX-ADAS and SPEX-FAC calculations are plotted in panels a and c, and those with EBIT-calibrated rates are shown in panels b and d. Total model, Fe XVII transitions, and Fe XVI transitions are shown in black, red, and blue. Local C-stat values are given at the top. The total model is omitted in the 17 Å plot, as it would overlap with the Fe XVII lines.
Current usage metrics show cumulative count of Article Views (full-text article views including HTML views, PDF and ePub downloads, according to the available data) and Abstracts Views on Vision4Press platform.
Data correspond to usage on the plateform after 2015. The current usage metrics is available 48-96 hours after online publication and is updated daily on week days.
Initial download of the metrics may take a while.