Free Access
Fig. 10.
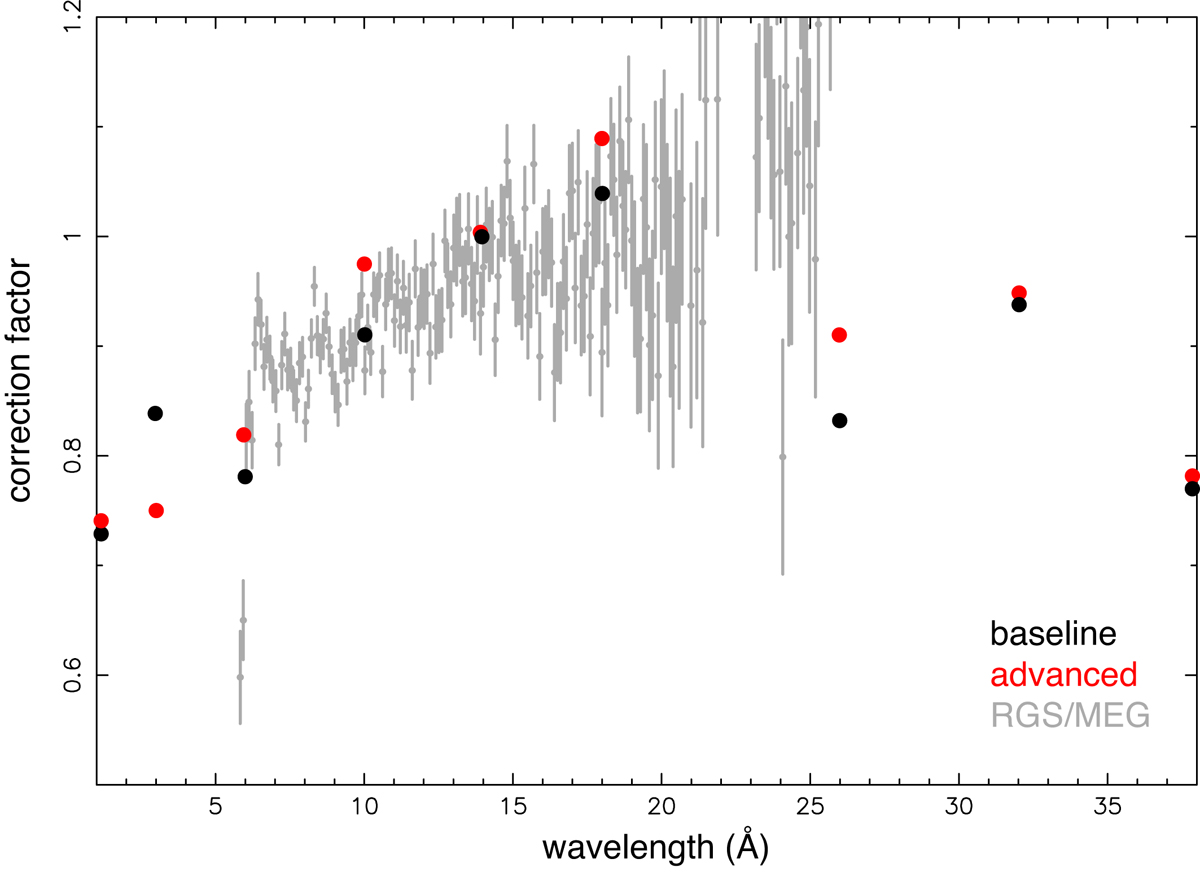
Effective area correction factors from the baseline and the advanced fits shown in black and red data points, respectively. They are compared with the average effective area ratios between the XMM-Newton Reflection Grating Spectrometer and the Chandra Medium Energy Grating for a sample of AGN sources (Kaastra, priv. comm.).
Current usage metrics show cumulative count of Article Views (full-text article views including HTML views, PDF and ePub downloads, according to the available data) and Abstracts Views on Vision4Press platform.
Data correspond to usage on the plateform after 2015. The current usage metrics is available 48-96 hours after online publication and is updated daily on week days.
Initial download of the metrics may take a while.