Open Access
Fig. 7.
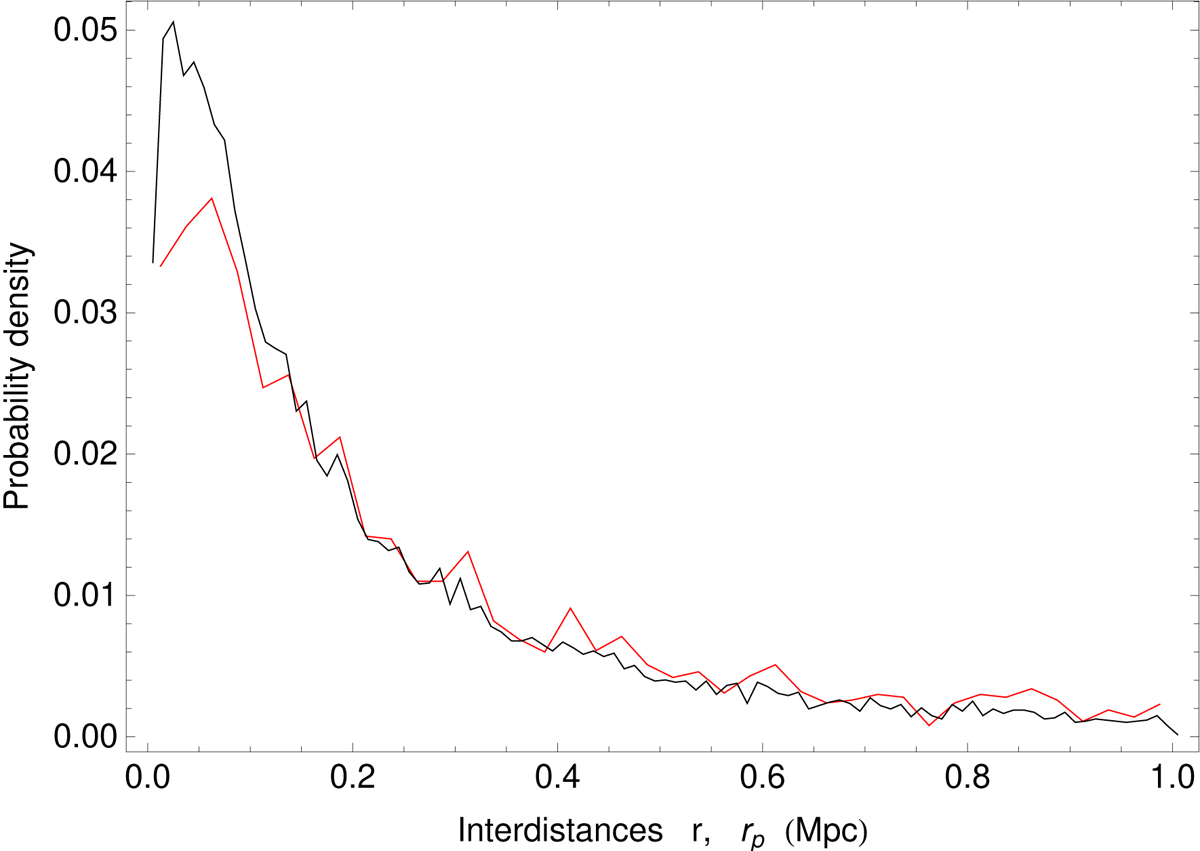
Probability density distributions of the interdistances between members of galaxy pairs in the IGP Catalog. The black curve indicates the observed (projected) PDF. The red curve represents the bias correct, deprojected PDF (see text about the deprojection method). Both curves are normalized to an effective bin of 0.01 Mpc.
Current usage metrics show cumulative count of Article Views (full-text article views including HTML views, PDF and ePub downloads, according to the available data) and Abstracts Views on Vision4Press platform.
Data correspond to usage on the plateform after 2015. The current usage metrics is available 48-96 hours after online publication and is updated daily on week days.
Initial download of the metrics may take a while.