Fig. 6.
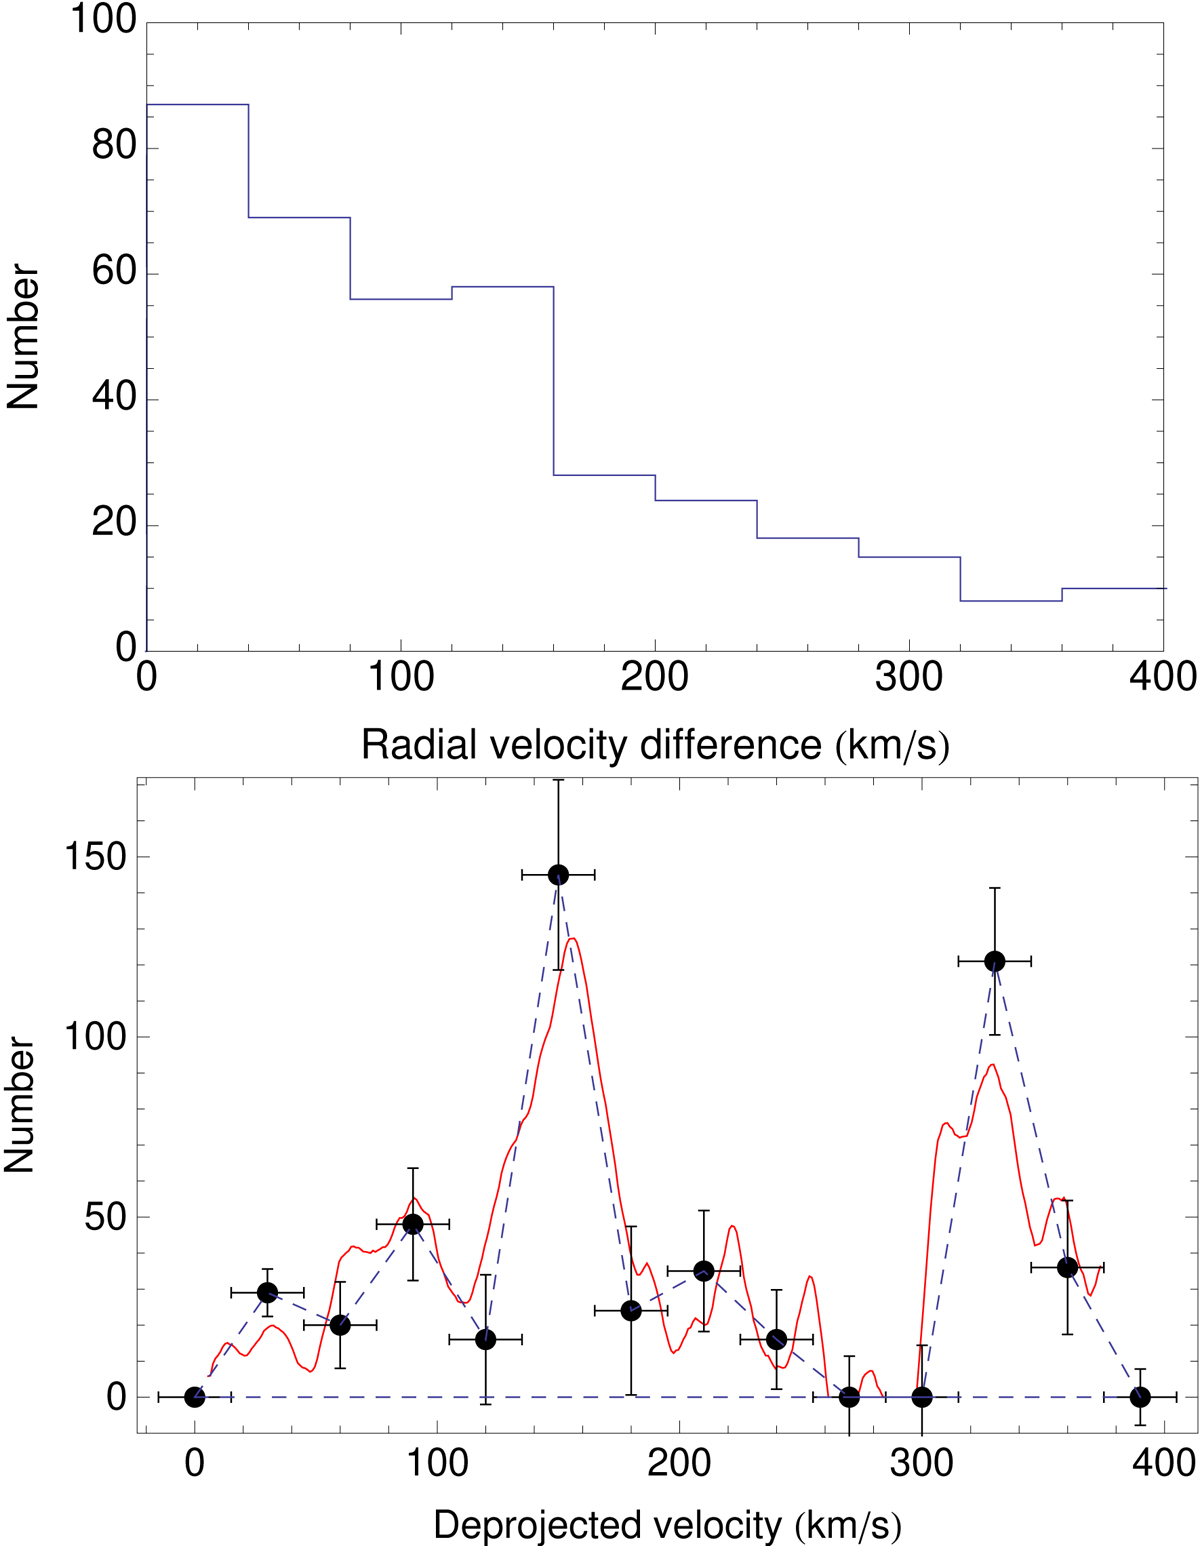
Upper panel: histogram of the projected (i.e., radial) velocity differences between members of galaxy pairs in the UGC pair catalog for a bin width of 40 km s−1. Lower panel: deprojected PDF of the 3D true intervelocities between members of galaxy pairs in the UGC pair Catalog, for the unbiased subsample with blue major axes < 1.2 arcmin. The red continuous curve is obtained by the deprojection method using a moving bin. The dashed black curve represents the result of deprojection by constant bins of width 30 km s−1. Both methods yield a main peak at ≈150 km s−1 and a possible secondary peak at ≈350 km s−1, in agreement with the results from the IGP catalog.
Current usage metrics show cumulative count of Article Views (full-text article views including HTML views, PDF and ePub downloads, according to the available data) and Abstracts Views on Vision4Press platform.
Data correspond to usage on the plateform after 2015. The current usage metrics is available 48-96 hours after online publication and is updated daily on week days.
Initial download of the metrics may take a while.