Fig. 5.
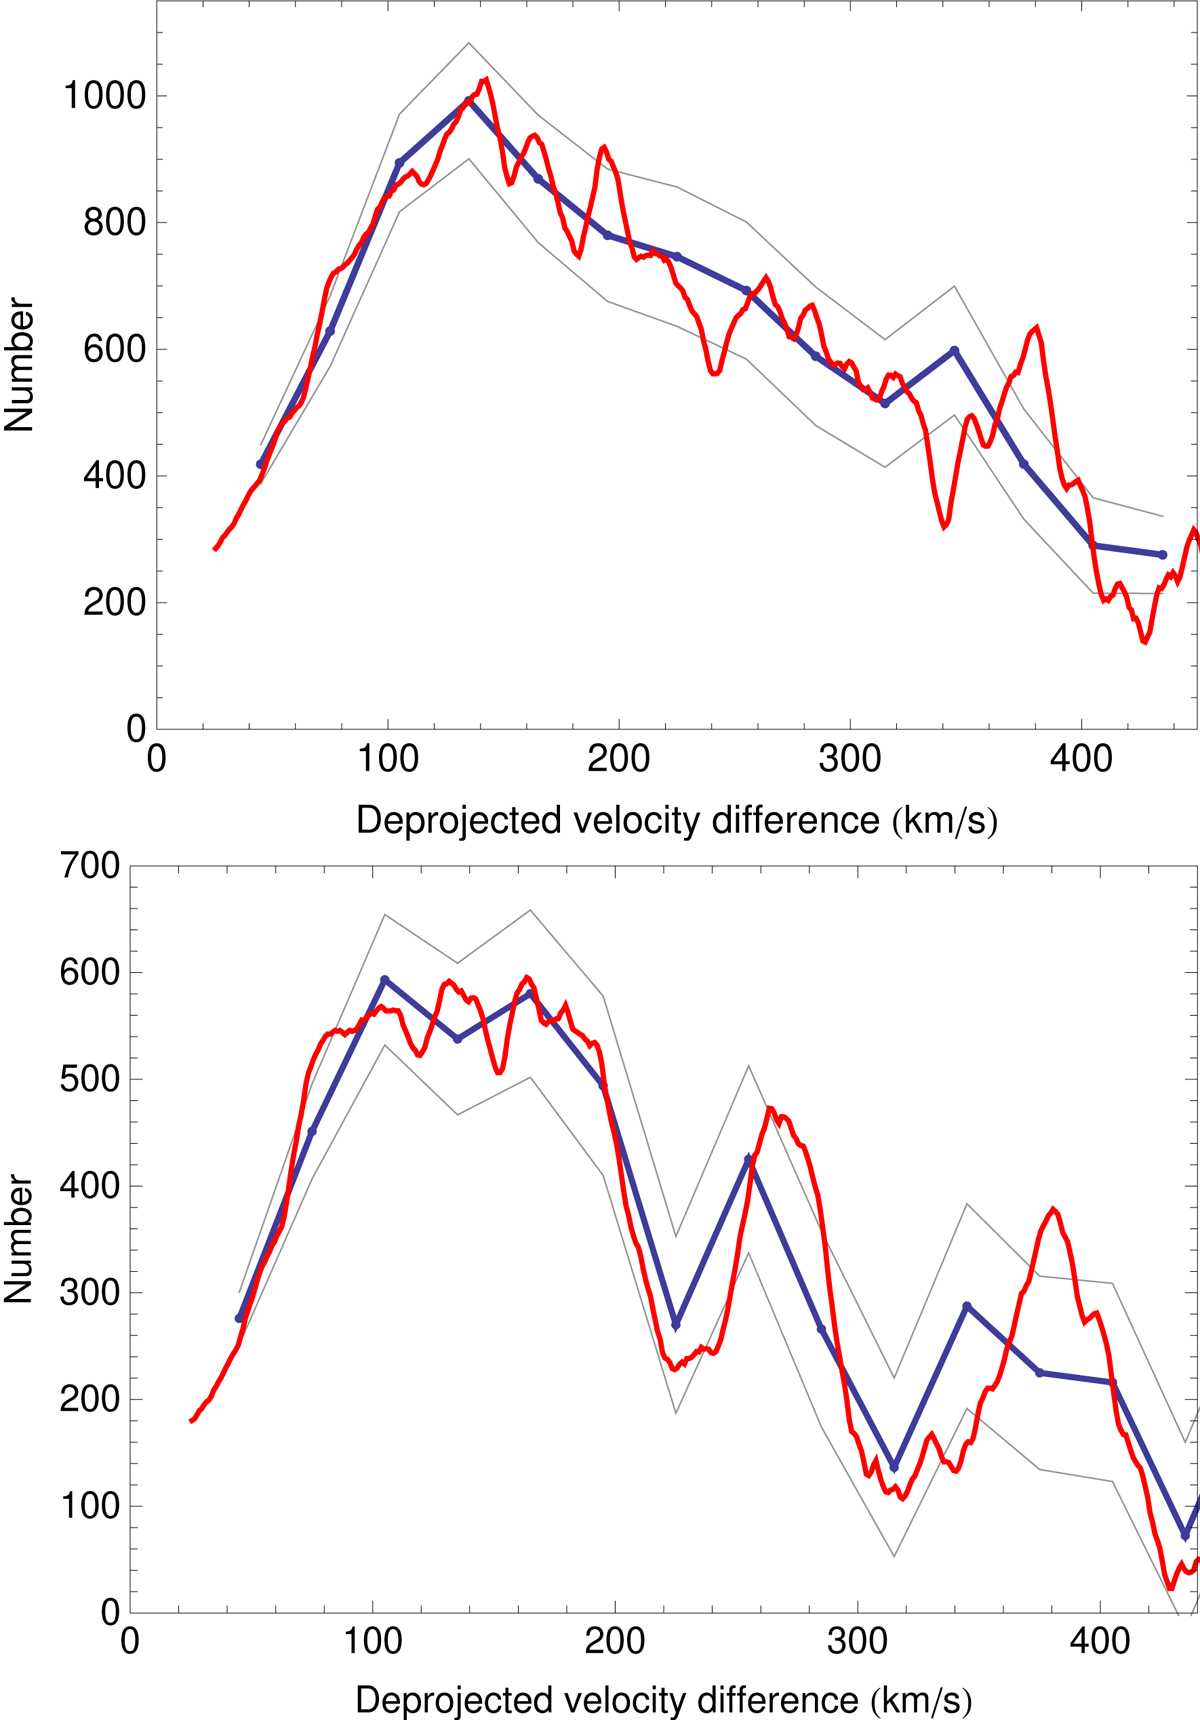
Deprojected PDF of the 3D true intervelocities between members of galaxy pairs in the IGP Catalog (all ρ > 2.5 values). The blue curves are obtained by the deprojection method using two-bin differences (bin of 30 km s−1). The red curves indicate the result of deprojection by moving bins (see text and Nottale & Chamaraux 2018a). The ±1σ uncertainty curves (gray lines) are obtained from simulation of the deprojection process. Both methods agree within error bars. Upper panel: subsample of 11 259 pairs with errors < 70 km s−1. The projected distribution of these pairs is given in Fig. 2. Lower panel: subsample of 6026 pairs having accurate velocities with errors < 20 km s−1. Both subsamples confirm the existence of a large probability peak around ≈150 km s−1, in agreement with the PDFs of fairly (Fig. 4) and highly isolated pair (Fig. 3) intervelocities.
Current usage metrics show cumulative count of Article Views (full-text article views including HTML views, PDF and ePub downloads, according to the available data) and Abstracts Views on Vision4Press platform.
Data correspond to usage on the plateform after 2015. The current usage metrics is available 48-96 hours after online publication and is updated daily on week days.
Initial download of the metrics may take a while.