Fig. 4.
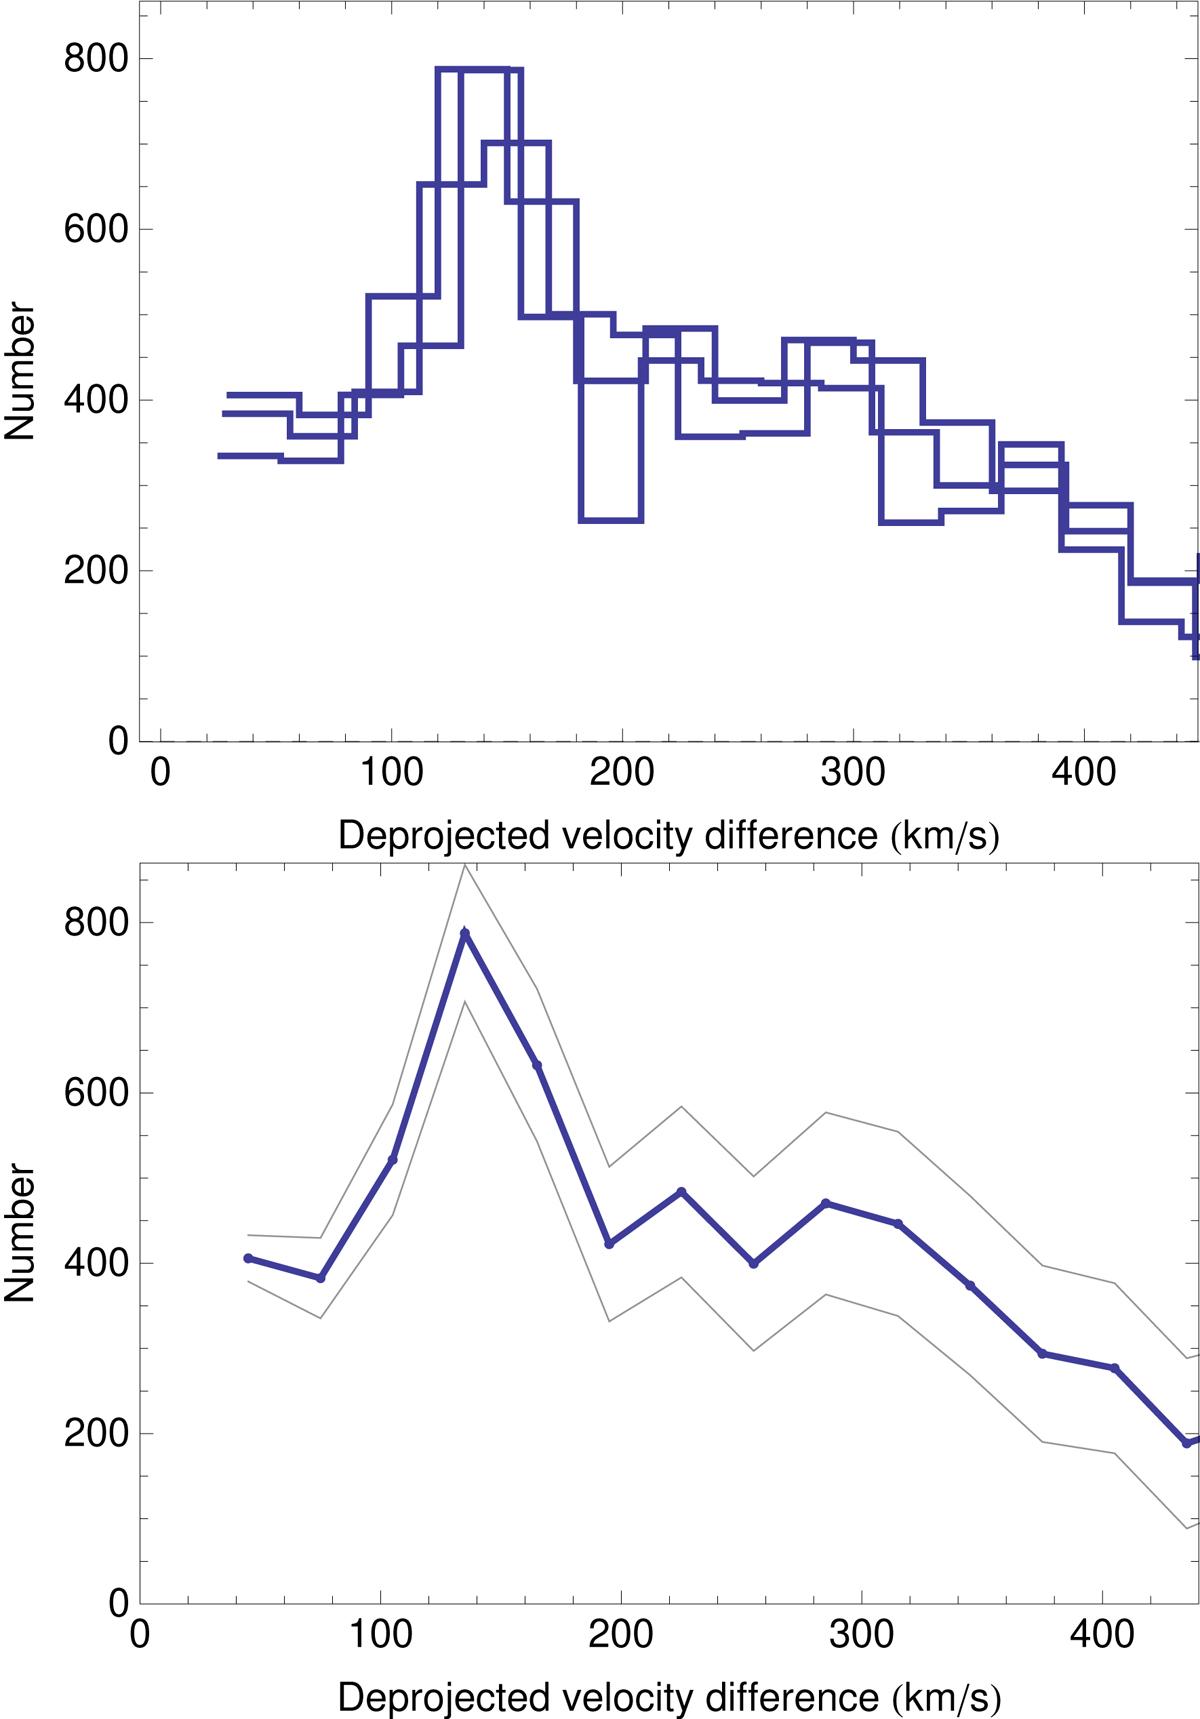
Probability distribution function of the 3D true intervelocities between members of galaxy pairs in the IGP Catalog (deprojected from radial velocity differences) for the subsample of 7449 fairly isolated pairs ρ > 5 (see text). Upper panel: deprojection method used here is the two-bin difference, with bins of 26, 28 and 30 km s−1. Lower panel: two-bin difference deprojection method, for a bin width 30 km s−1, accompanied by the estimated uncertainties derived from numerical simulations (±1 σ, gray curves). The uncertainties derived from the simulation clearly agree with the fluctuations observed for different bins in the left panel. No matter which bin width and method are used, a probability peak at ≈150 km s−1 appears to be stable.
Current usage metrics show cumulative count of Article Views (full-text article views including HTML views, PDF and ePub downloads, according to the available data) and Abstracts Views on Vision4Press platform.
Data correspond to usage on the plateform after 2015. The current usage metrics is available 48-96 hours after online publication and is updated daily on week days.
Initial download of the metrics may take a while.