Open Access
Fig. 2.
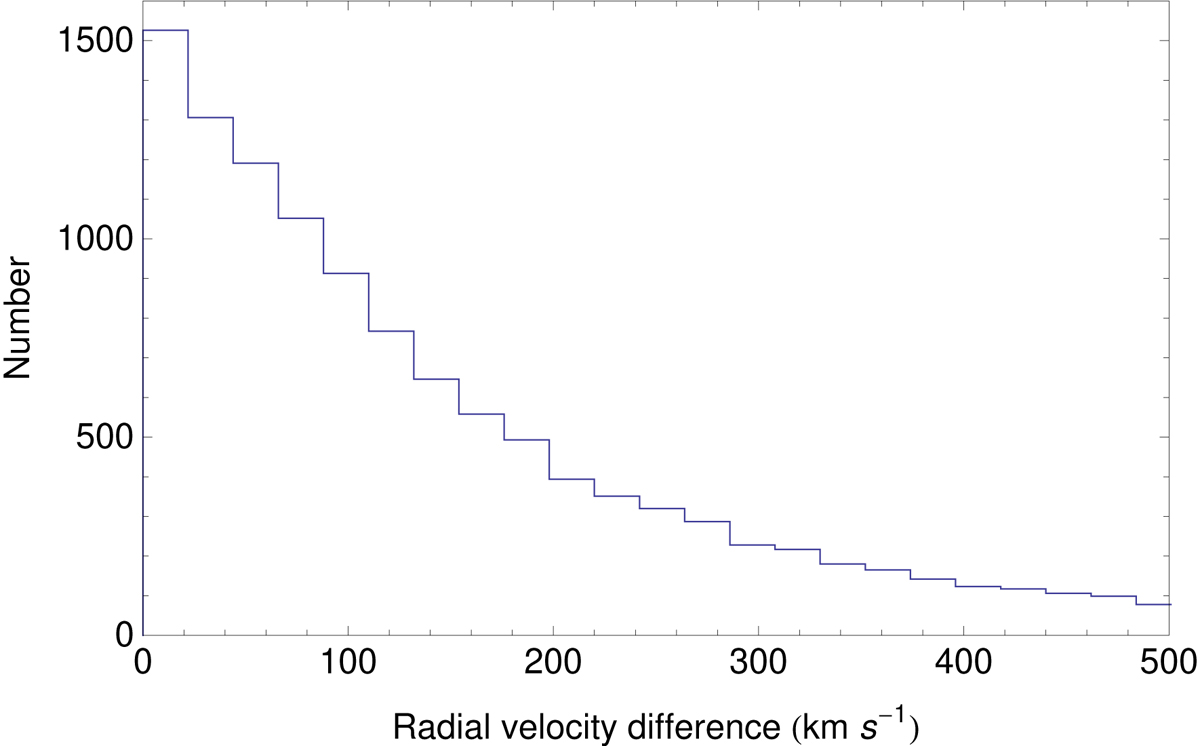
Histogram of the projected intervelocities between members of galaxy pairs in the IGP Catalog, for the subsample of 11 259 pairs having errors < 70 km s−1. The bin is 22 km s−1. The observed distribution agrees with the expected monotony of the projected PDF.
Current usage metrics show cumulative count of Article Views (full-text article views including HTML views, PDF and ePub downloads, according to the available data) and Abstracts Views on Vision4Press platform.
Data correspond to usage on the plateform after 2015. The current usage metrics is available 48-96 hours after online publication and is updated daily on week days.
Initial download of the metrics may take a while.