Fig. 16.
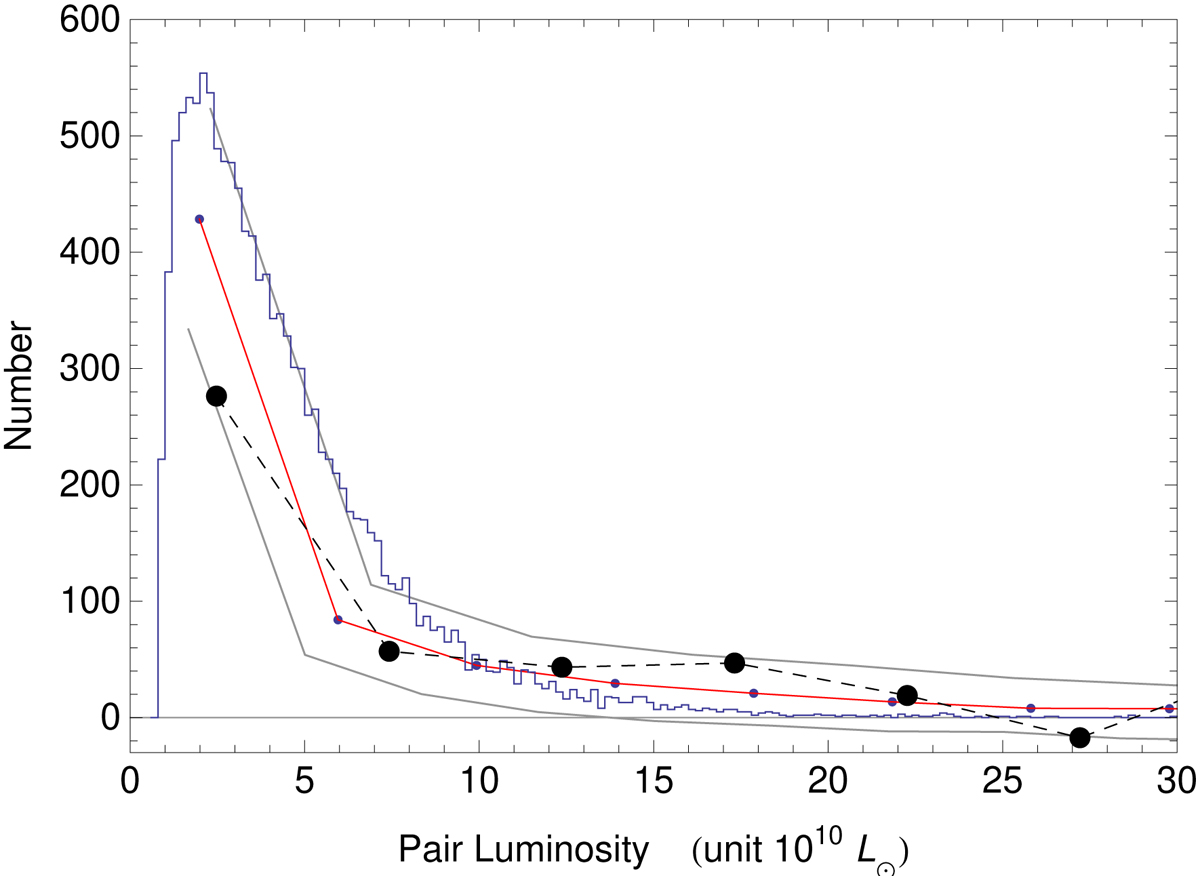
Deprojection of the product ![]() (black points), compared with the total luminosity PDF of IGPC pairs (blue histogram). The product of 3D variables rv2 gives the total mass of the pair (in the circular orbit approximation). The resulting mass has been translated into luminosity through a constant M/L ratio. The red line results from a numerical simulation that facilitates settling the uncertainty of the deprojection (two black lines, ±1 sigma). The luminosity PDF falls within ≈ one sigma of the deprojected points, allowing the derivation of a mass over luminosity ratio of M/L = 30 ± 5.
(black points), compared with the total luminosity PDF of IGPC pairs (blue histogram). The product of 3D variables rv2 gives the total mass of the pair (in the circular orbit approximation). The resulting mass has been translated into luminosity through a constant M/L ratio. The red line results from a numerical simulation that facilitates settling the uncertainty of the deprojection (two black lines, ±1 sigma). The luminosity PDF falls within ≈ one sigma of the deprojected points, allowing the derivation of a mass over luminosity ratio of M/L = 30 ± 5.
Current usage metrics show cumulative count of Article Views (full-text article views including HTML views, PDF and ePub downloads, according to the available data) and Abstracts Views on Vision4Press platform.
Data correspond to usage on the plateform after 2015. The current usage metrics is available 48-96 hours after online publication and is updated daily on week days.
Initial download of the metrics may take a while.