Fig. 13.
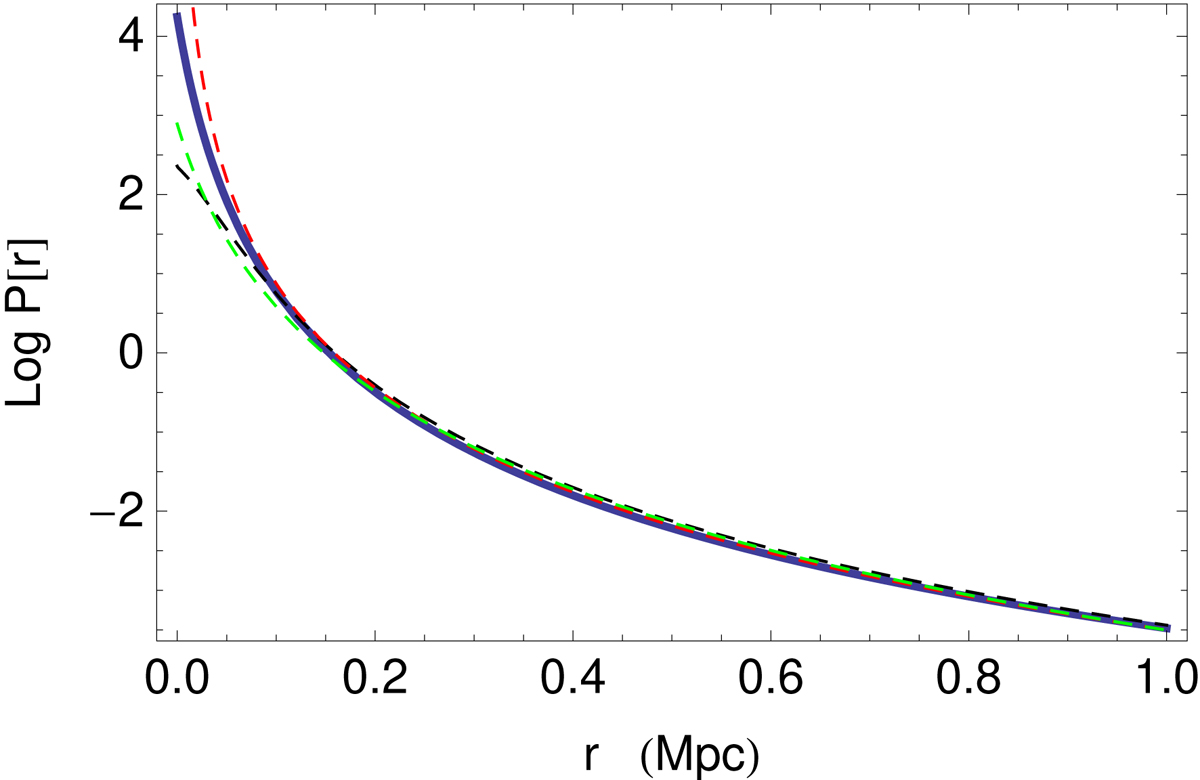
Analytical integration of the PDF of interdistances from an exponential mass PDF and a Gaussian intervelocity PDF, compared to various expectations. Blue curve: the exact integral; red dashed curve: pure power law with exponent −1.9; the black dashed curve: precise fit of deprojected data; and green dashed curve: Hubble profile P(r)∝(1 + r/a)−2.1 with a = 0.05. As expected, the analytical integral is no longer valid at very small distances r < 0.1 Mpc.
Current usage metrics show cumulative count of Article Views (full-text article views including HTML views, PDF and ePub downloads, according to the available data) and Abstracts Views on Vision4Press platform.
Data correspond to usage on the plateform after 2015. The current usage metrics is available 48-96 hours after online publication and is updated daily on week days.
Initial download of the metrics may take a while.