Fig. 7.
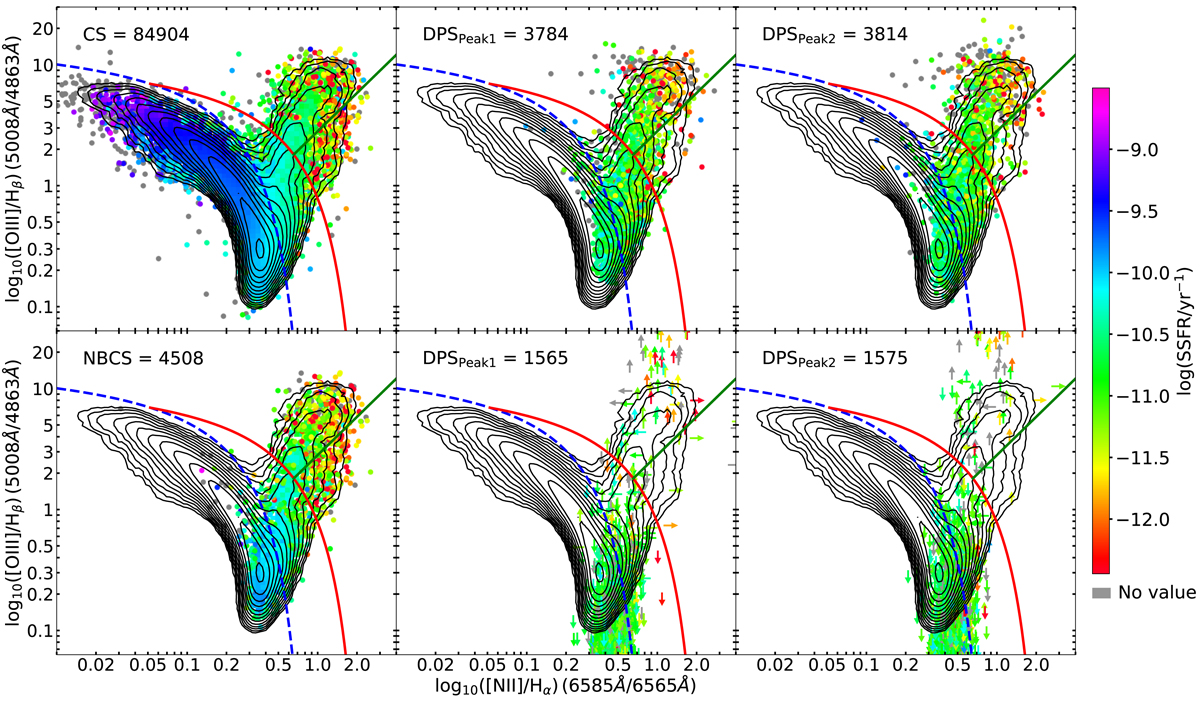
BPT diagrams used to classify our samples into different galaxy types (Kewley et al. 2006b). The red line separates active galactic nuclei (AGN) and composite galaxies (COMP) (Kewley et al. 2001). AGNs and low ionisation narrow emission line regions (LINER) are separated by the green line (Schawinski et al. 2007) and the blue dashed lines separate star forming (SF) and COMP (Kewley et al. 2006b). We present the CS in the upper left panel and the NBCS in the lower left panel. In the upper middle (resp. right) panel, we show the blueshifted (resp. redshifted) peaks of DP galaxies with a S/N > 3 in the four emission line fluxes needed for the BPT diagram. In the lower middle and right panels, we display those emission line components of the DPS with three of the requested emission lines with S/N > 3 and the fourth S/N < 3. To classify them, we display arrows to indicate the limits derived by the uncertainties of weak emission lines. In all six panels, we apply the same colour-coding indicating the specific star formation rate (SSFR) computed by Salim et al. (2016). We display in all panels the same contour lines corresponding to the density of the CS. The corresponding classifications are presented in Table 4.
Current usage metrics show cumulative count of Article Views (full-text article views including HTML views, PDF and ePub downloads, according to the available data) and Abstracts Views on Vision4Press platform.
Data correspond to usage on the plateform after 2015. The current usage metrics is available 48-96 hours after online publication and is updated daily on week days.
Initial download of the metrics may take a while.