Fig. 5.
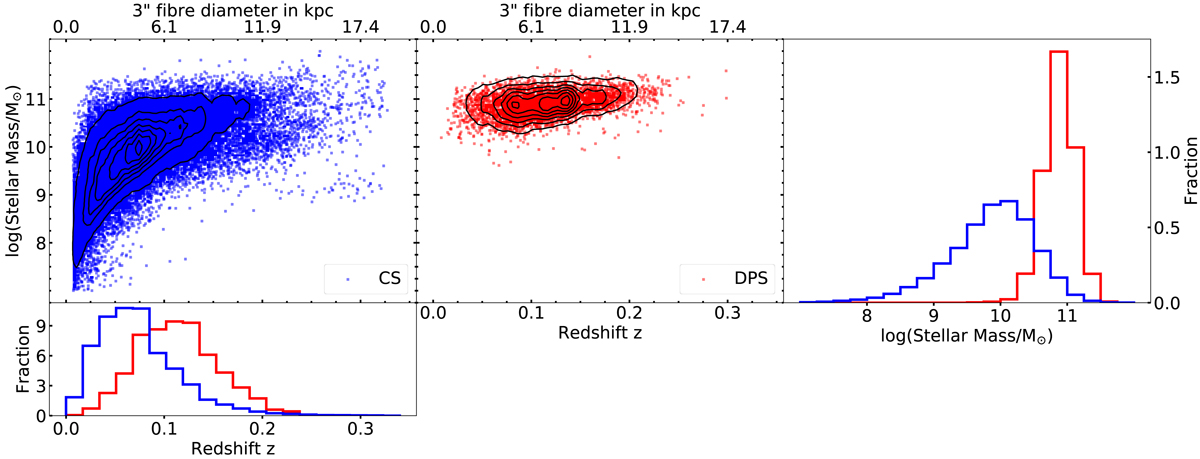
Stellar mass-redshift distribution for the CS (blue, top left panel) and the DPS (red, top middle panel). The contours indicate the density level. In the top right panel, we show the histogram of stellar masses and, on the bottom left panel, the histogram of redshifts. We also display the fibre diameter corresponding to 3″ on top of the upper left and middle panels.
Current usage metrics show cumulative count of Article Views (full-text article views including HTML views, PDF and ePub downloads, according to the available data) and Abstracts Views on Vision4Press platform.
Data correspond to usage on the plateform after 2015. The current usage metrics is available 48-96 hours after online publication and is updated daily on week days.
Initial download of the metrics may take a while.