Fig. C.1.
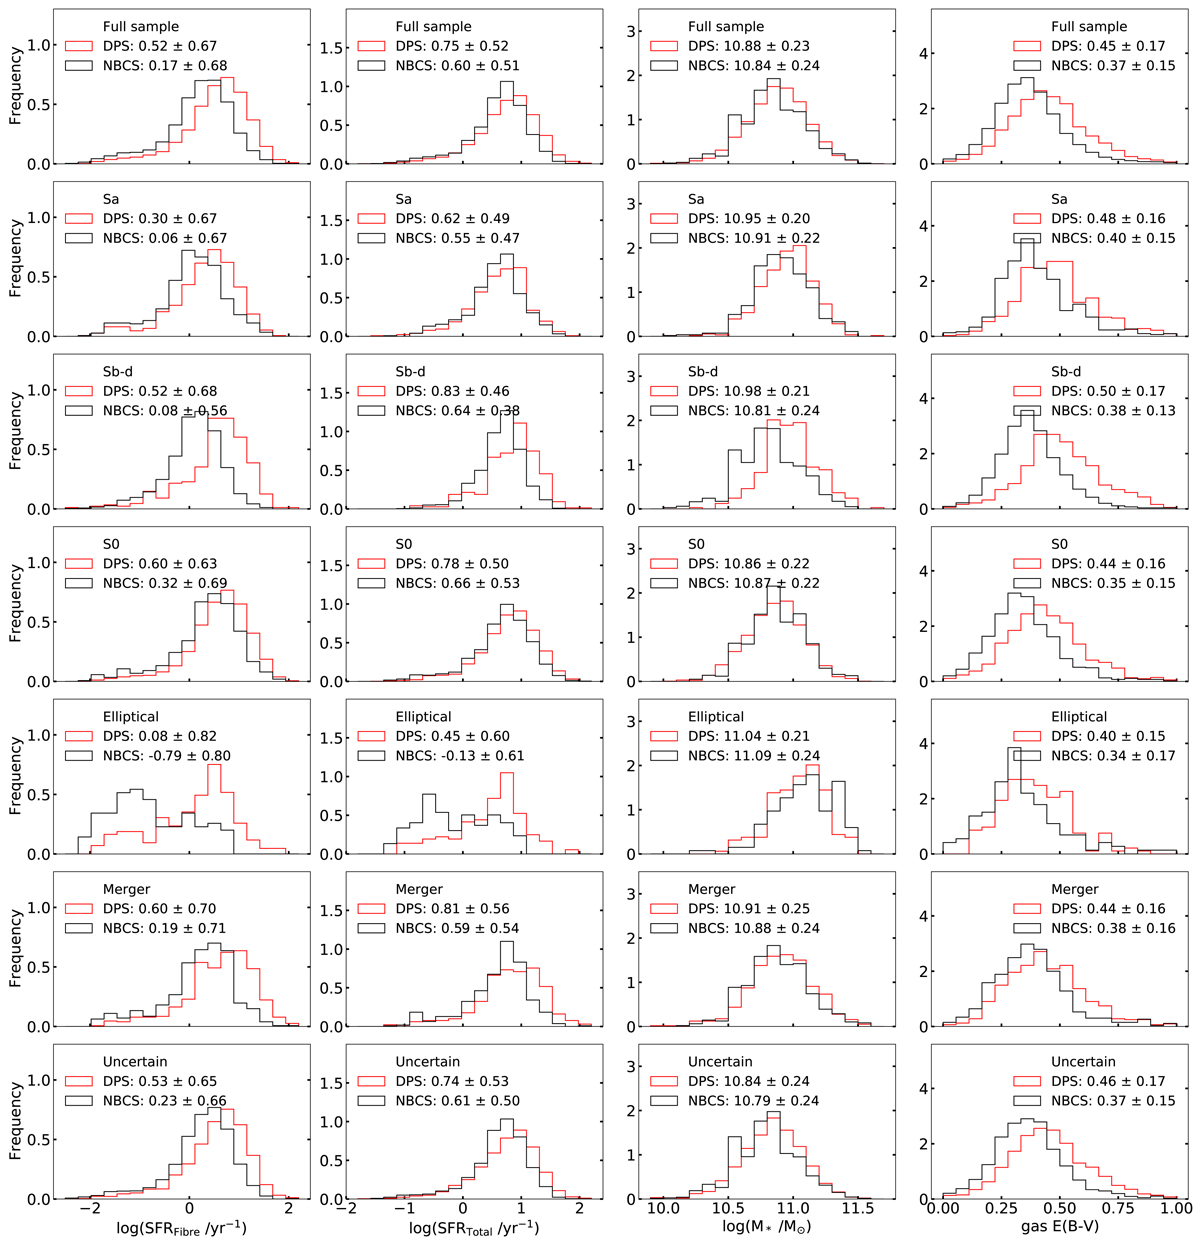
Each column presents distributions of different parameters of the DPS (red) and the NBCS (black). We show different morphological classifications in each row: in the top row the full samples, followed by Sa, Sb-d, S0s, elliptical, merger and galaxies without classification (see Sect. 3.2). From left to right: first column: star formation rate inside the 3″ SDSS fibre (SFRfibre), second column: total star formation rate (SFRTotal) (Brinchmann et al. 2004), third column: stellar mass M* (Kauffmann et al. 2003). last column: extinction computed with the Balmer decrements Hα/Hβ (Domínguez et al. 2013). We use the non-parametric emission line fit to estimate emission line fluxes taken from Chilingarian et al. (2017). We display the mean and the standard deviation for each distribution.
Current usage metrics show cumulative count of Article Views (full-text article views including HTML views, PDF and ePub downloads, according to the available data) and Abstracts Views on Vision4Press platform.
Data correspond to usage on the plateform after 2015. The current usage metrics is available 48-96 hours after online publication and is updated daily on week days.
Initial download of the metrics may take a while.