Fig. B.1.
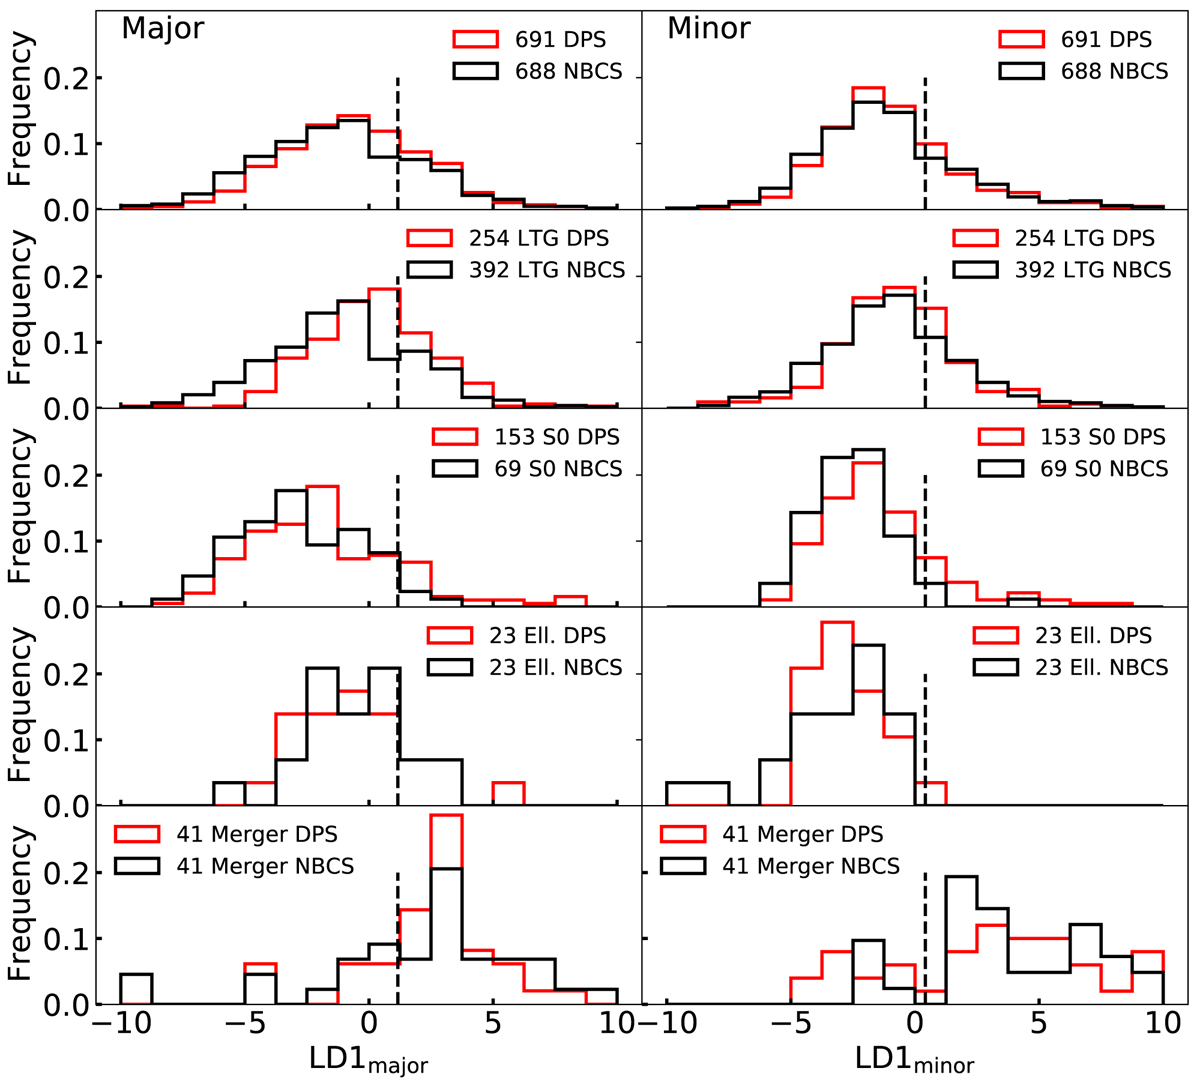
Distribution of predictor coefficients LD1major on the left panels and LD1minor on the right panels (Nevin et al. 2019) for galaxies with z < 0.075. We mark the decision boundary for LD1major (resp. LD1minor) with black dashed lines at > 1.16 (resp. > 0.42). We show the DPS in red lines and NBCS in black lines. We show all galaxies in the top panels and present LTG, S0, elliptical and merger galaxies in the lower panels respectively.
Current usage metrics show cumulative count of Article Views (full-text article views including HTML views, PDF and ePub downloads, according to the available data) and Abstracts Views on Vision4Press platform.
Data correspond to usage on the plateform after 2015. The current usage metrics is available 48-96 hours after online publication and is updated daily on week days.
Initial download of the metrics may take a while.