Fig. 2.
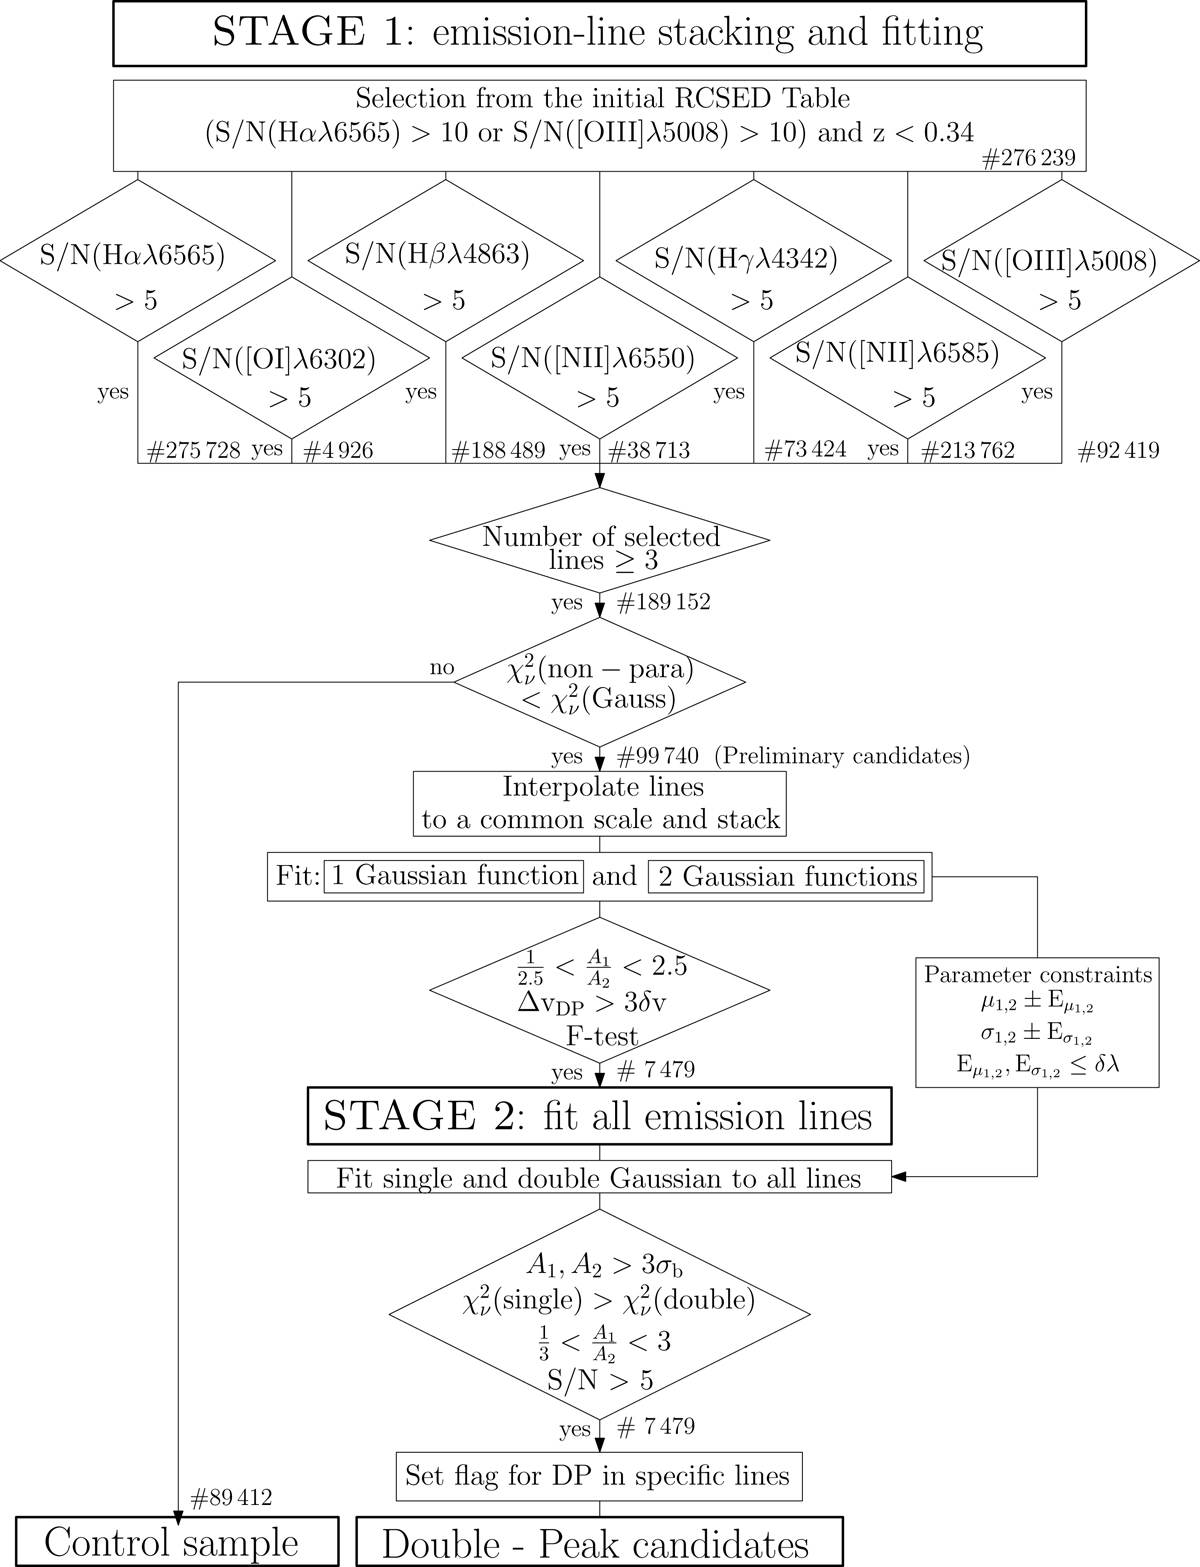
Flowchart describing the first two stages of the automated selection procedure, detailed in Sect. 2.2. We list up all selection criteria and note the number of galaxies at each selection step. In stage 1 we select preliminary candidates and a control sample (CS) using emission line properties and χ2 ratios from emission line fitting computed by Chilingarian et al. (2017). We visualise the stacking and fitting procedure and all selection criteria described in Sect. 2.2.2. In stage 2 we describe the individual fitting of each emission line and list up all criteria for the DP flag detailed in Sect. 2.2.4. We finally select 7479 DP candidates and 89 412 galaxies for the CS.
Current usage metrics show cumulative count of Article Views (full-text article views including HTML views, PDF and ePub downloads, according to the available data) and Abstracts Views on Vision4Press platform.
Data correspond to usage on the plateform after 2015. The current usage metrics is available 48-96 hours after online publication and is updated daily on week days.
Initial download of the metrics may take a while.