Fig. 18.
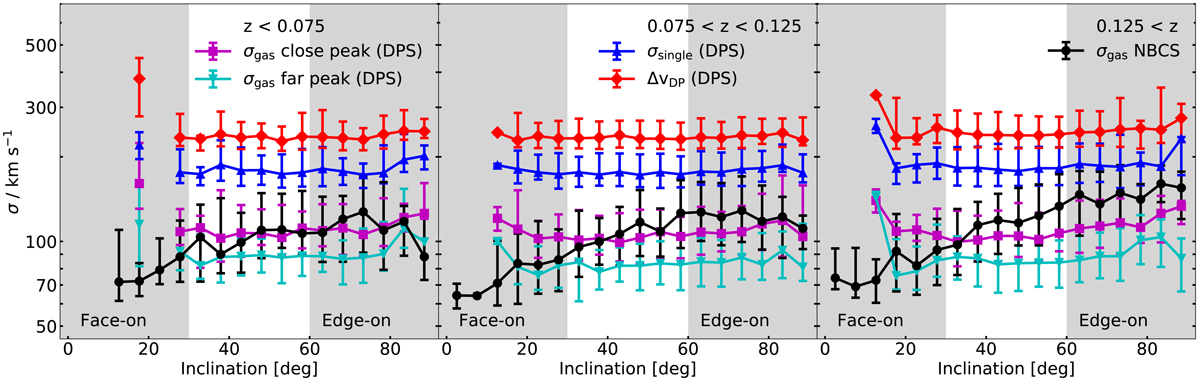
Influence of the inclination on the velocity dispersion. We show different velocity dispersion distributions as a function of the galaxy inclination for different groups of redshift. We only show LTG and S0 galaxies for which we can compute the inclination using Meert et al. (2015). For the DPS, we show ΔV with red dots, σsingle of the single Gaussian approximation in blue (see Sect. 4.3.2) and in magenta (resp. cyan) the σ of the emission line component which is closer (resp. offset) to the stellar velocity in units of σ. We show the σgas for the NBCS with black dots. All data points represent the medians in the inclination intervals and the error bars the 16th to 84th percentiles.
Current usage metrics show cumulative count of Article Views (full-text article views including HTML views, PDF and ePub downloads, according to the available data) and Abstracts Views on Vision4Press platform.
Data correspond to usage on the plateform after 2015. The current usage metrics is available 48-96 hours after online publication and is updated daily on week days.
Initial download of the metrics may take a while.