Open Access
Fig. 16.
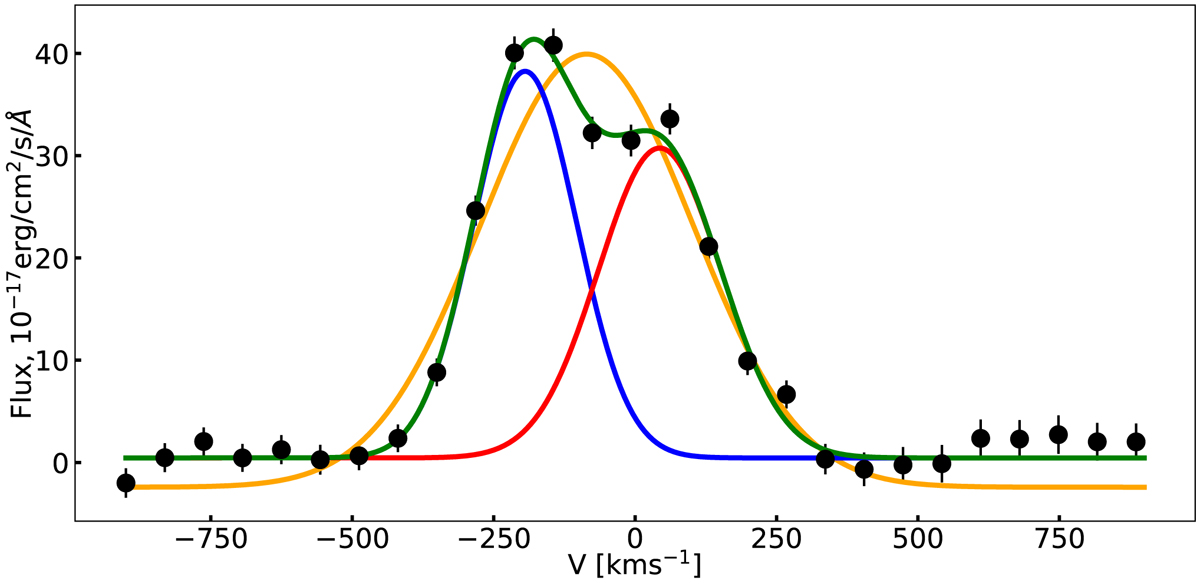
Single Gaussian approximation. We compute the two Gaussian functions resulting from the double Gaussian fit procedure to the stacked emission line in Sect. 2.2. The blueshifted component is represented by a blue and the redshifted by a red line. In orange, we show the best fit of a single Gaussian function.
Current usage metrics show cumulative count of Article Views (full-text article views including HTML views, PDF and ePub downloads, according to the available data) and Abstracts Views on Vision4Press platform.
Data correspond to usage on the plateform after 2015. The current usage metrics is available 48-96 hours after online publication and is updated daily on week days.
Initial download of the metrics may take a while.