Fig. 15.
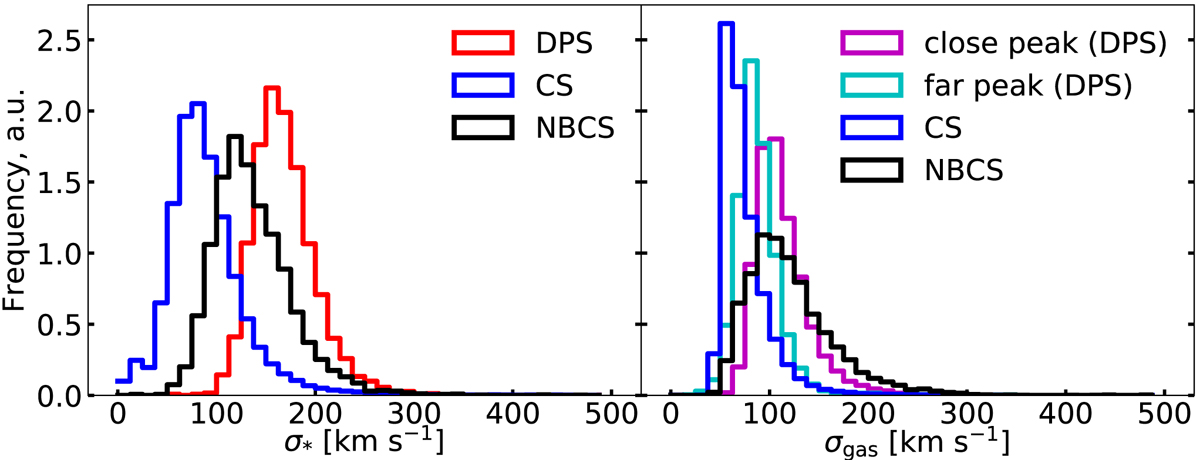
Velocity dispersion distributions for the CS (blue), the NBCS (black) and the DPS (red, purple and orange). The left panel displays the stellar velocity dispersion σ* computed from Chilingarian et al. (2017). The second panel shows the gas velocity dispersion σgas. We compute the Gaussian emission line dispersion for the CS and the NBCS from (Chilingarian et al. 2017). For the DPS, we display the σ1, 2 of the emission line components, which is closer to the galaxy stellar velocity in units of σ1, 2 in magenta and the component which is more offset in cyan. For better comparisons, we unify the surface of the histograms of the left (resp. right) panel to 150 (resp. 100).
Current usage metrics show cumulative count of Article Views (full-text article views including HTML views, PDF and ePub downloads, according to the available data) and Abstracts Views on Vision4Press platform.
Data correspond to usage on the plateform after 2015. The current usage metrics is available 48-96 hours after online publication and is updated daily on week days.
Initial download of the metrics may take a while.