Fig. 13.
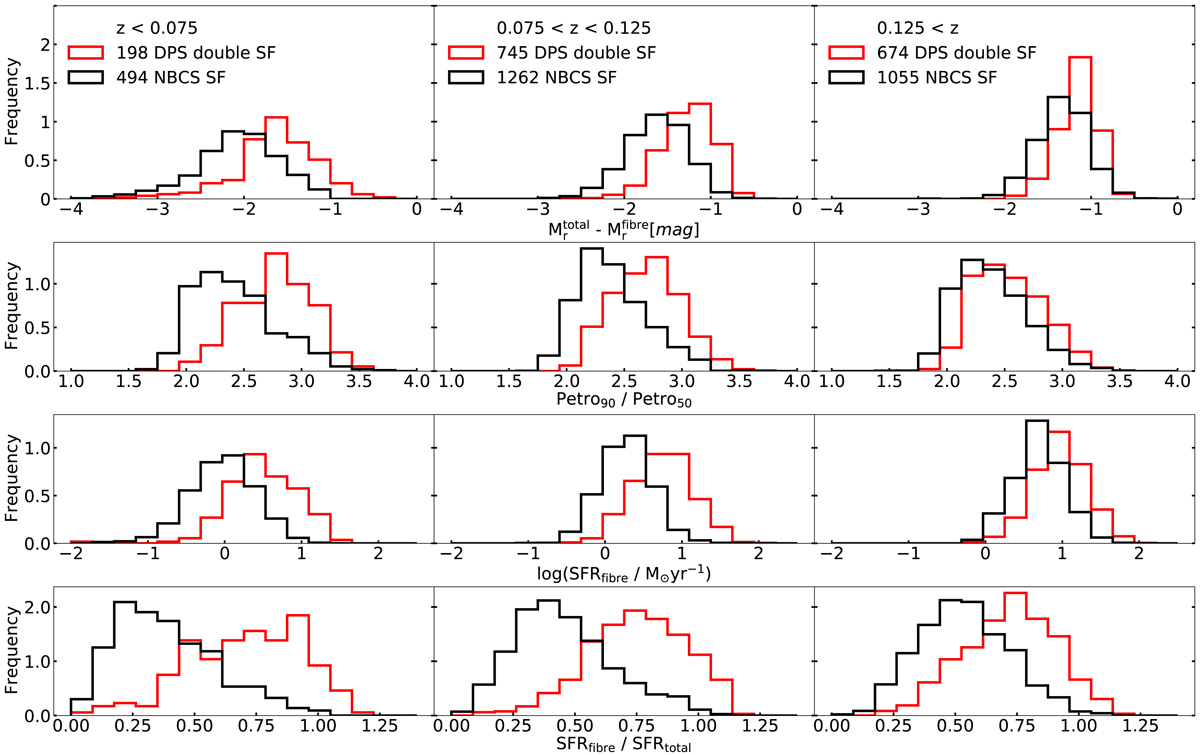
Distribution of different observables within the 3″ SDSS fibre. We show in three columns three different ranges of redshift. We present galaxies of the DPS which are classified as double SF in red and galaxies classified as SF of the NBCS in black (see Sect. 3.1) In the top row we show the difference in absolute r-band magnitude of the total galaxy and the 3″ SDSS fibre. The colours are Galactic dust- and k-corrected (Chilingarian et al. 2017). In the second row we present the ratio of the radii comprising 90% and 50% of the Petrosian luminosity (Petrosian 1976) approximating the central brightness in comparison to the total galaxy. We show the star formation ratio of the 3″ SDSS fibre SFRfibre in the third row and the ratio between fibre and total star formation (SFRfibre/SFRtotal ) in the bottom row (Brinchmann et al. 2004).
Current usage metrics show cumulative count of Article Views (full-text article views including HTML views, PDF and ePub downloads, according to the available data) and Abstracts Views on Vision4Press platform.
Data correspond to usage on the plateform after 2015. The current usage metrics is available 48-96 hours after online publication and is updated daily on week days.
Initial download of the metrics may take a while.