Fig. 12.
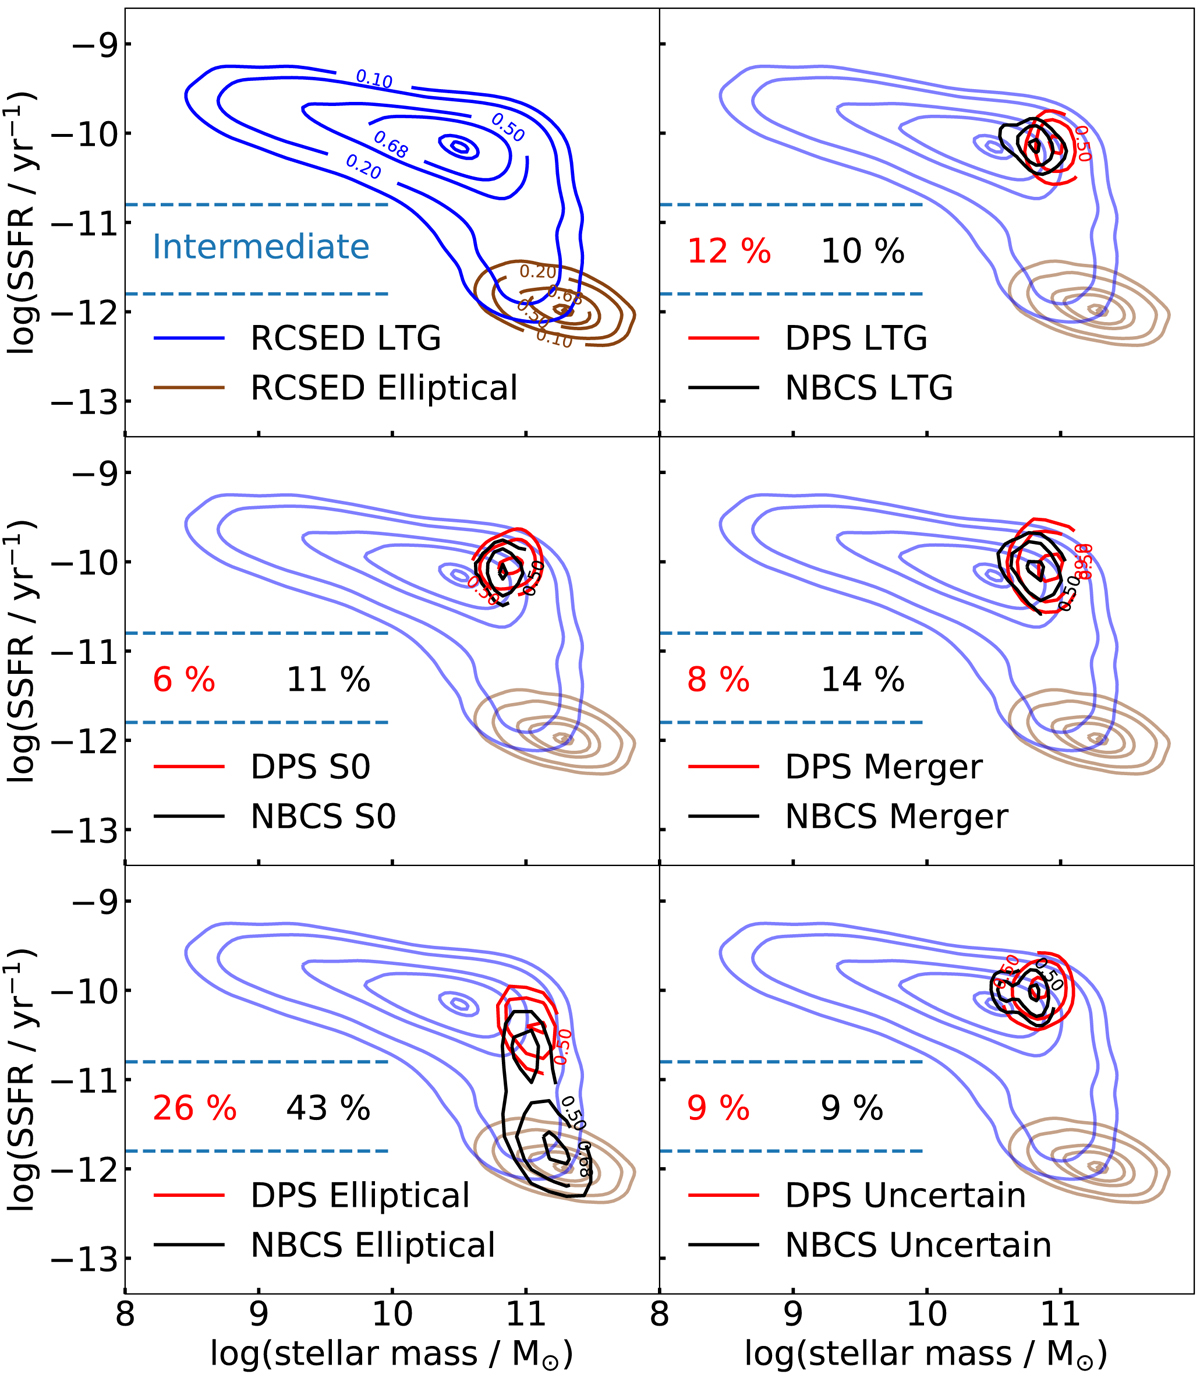
SSFR as a function of stellar mass. The top left panel presents LTG and elliptical galaxies selected from the RCSED catalogue using Domínguez Sánchez et al. (2018) as blue and brown contours. These contours are also shown as a reminder in the other panels. We show contour lines indicating the 50%, 68% and 95% level for different morphological subsamples of the DPS (red) and the NBCS (black). We indicate with blue dashed lines the region of intermediate star formation (−11.8 < log(SSFR/M⊙) < −10.8) (Salim 2014) and display the percentage of the morphological types situated in this zone.
Current usage metrics show cumulative count of Article Views (full-text article views including HTML views, PDF and ePub downloads, according to the available data) and Abstracts Views on Vision4Press platform.
Data correspond to usage on the plateform after 2015. The current usage metrics is available 48-96 hours after online publication and is updated daily on week days.
Initial download of the metrics may take a while.