Fig. 11.
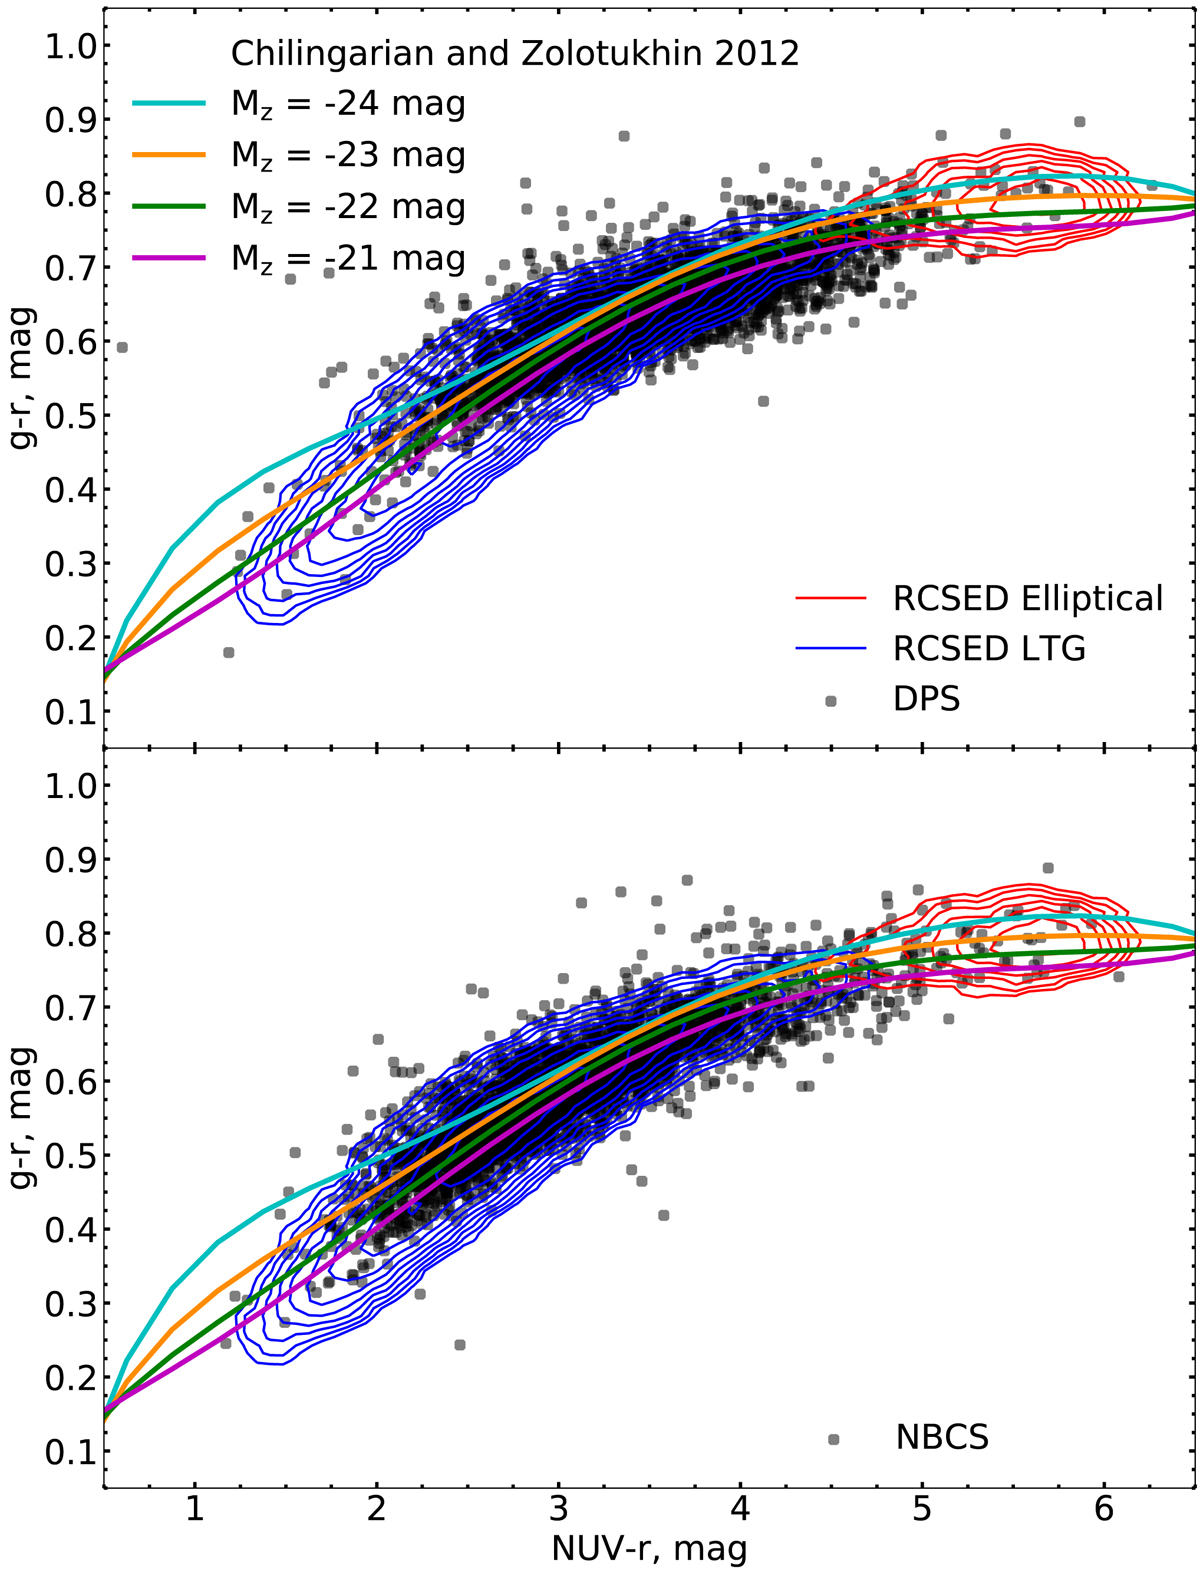
Colour-colour relation between g − r and NUV − r. We present LTG and elliptical galaxies selected from the RCSED catalogue using Domínguez Sánchez et al. (2018) as blue and red contours and show the DPS (resp. NBCS) as black dots in the top panel (resp. lower panel). We display the best-fitting polynomial surface equation of constant absolute z-band magnitudes with coloured lines (Chilingarian & Zolotukhin 2012).
Current usage metrics show cumulative count of Article Views (full-text article views including HTML views, PDF and ePub downloads, according to the available data) and Abstracts Views on Vision4Press platform.
Data correspond to usage on the plateform after 2015. The current usage metrics is available 48-96 hours after online publication and is updated daily on week days.
Initial download of the metrics may take a while.