Fig. 1.
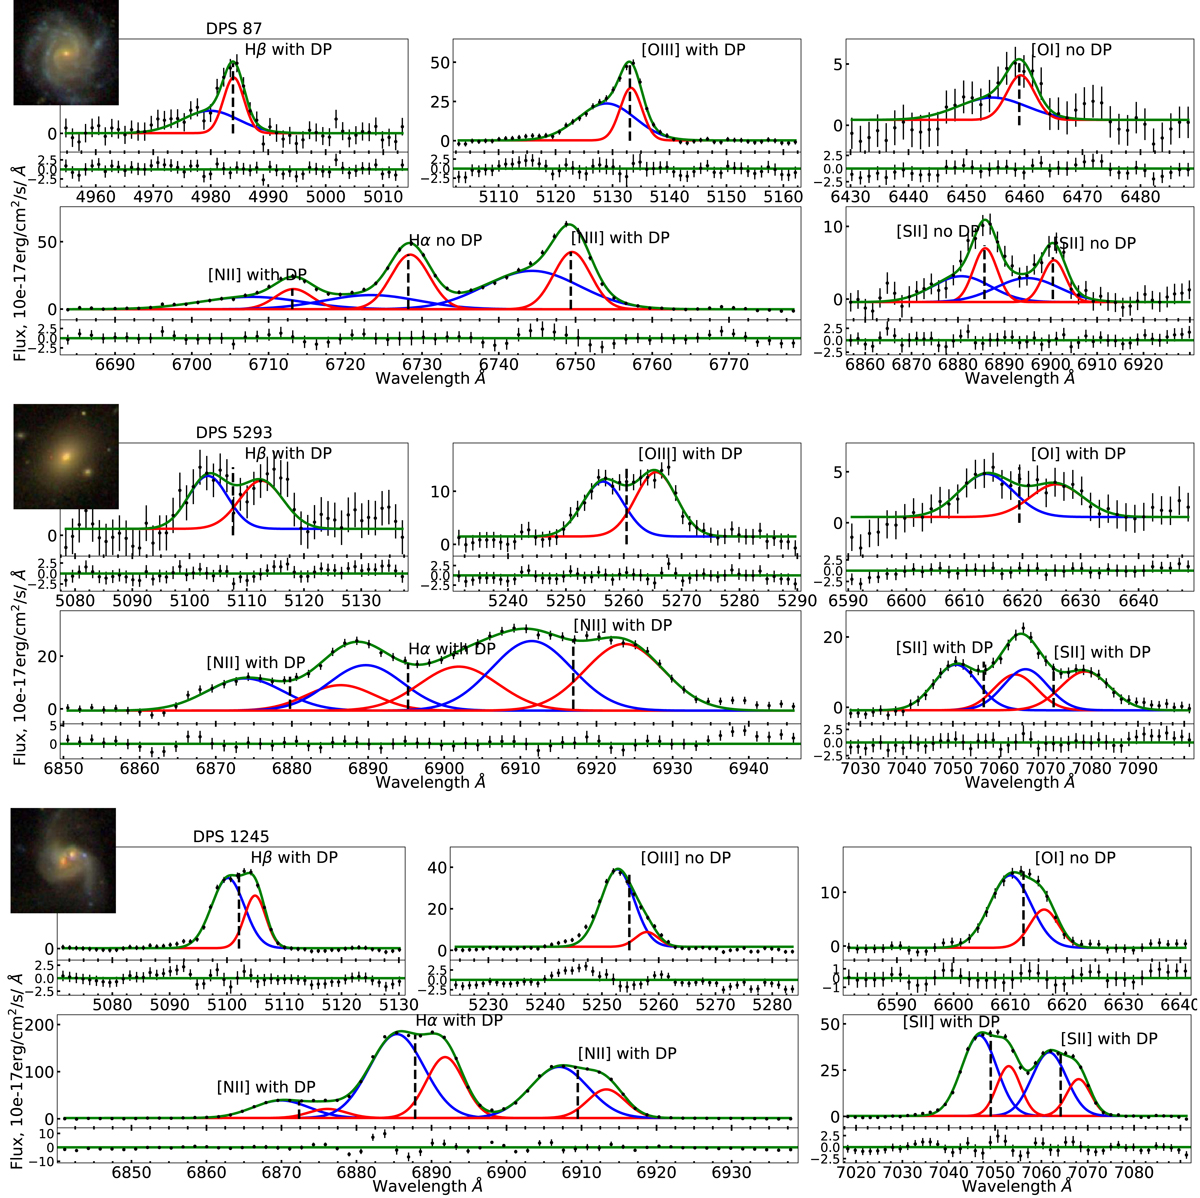
Emission lines of three DP galaxies, namely Hβλ4863, [OIII]λ5008, [OI]λ6302, [NII]λ 6550, Hαλ6565, [NII]λ 6585, [SII]λ6718 and [SII]λ 6733. For each panel, we display on the top left, the 62″ × 62″ SDSS snapshot. Each displayed line is fitted with a double Gaussian function as explained in Sect. 2.2. We show the blueshifted Gaussian component as blue lines and the redshifted component as red lines. The green line is a superposition of the two Gaussian components. Below each emission line we show residuals. We flag lines with a confirmed DP selected with criteria described in Sect. 2.2 as “with DP” and flag the others as “no DP” for failing the criteria. The black dashed vertical line indicates the position of the stellar velocity of the host galaxy, computed by Chilingarian et al. (2017). The top spectra are for a face-on spiral galaxy at a redshift of z = 0.02 with a ΔvDP = 232 km s−1, which resembles an outflow (discussed in Sect. 5.6). The middle spectra are for an elliptical galaxy at z = 0.05 showing a ΔvDP = 495 km s−1. The bottom spectra are for a galaxy merger at z = 0.05 and ΔvDP = 269 km s−1. This is one of 58 galaxies discussed in Maschmann & Melchior (2019) showing a DP structure probably associated with recent galaxy merger.
Current usage metrics show cumulative count of Article Views (full-text article views including HTML views, PDF and ePub downloads, according to the available data) and Abstracts Views on Vision4Press platform.
Data correspond to usage on the plateform after 2015. The current usage metrics is available 48-96 hours after online publication and is updated daily on week days.
Initial download of the metrics may take a while.