Fig. 3
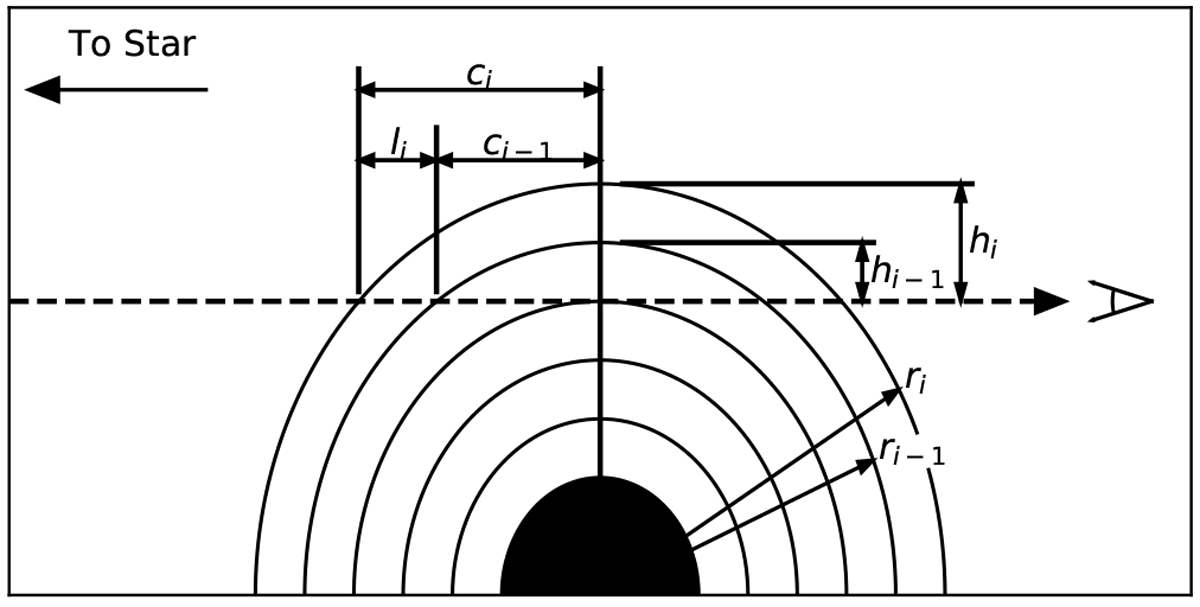
Schematic diagram of transmission chords along the line of sight for transmission spectrum calculation. Here, c is half the chord length along line of sight, l is the path length through a given layer of atmosphere, h is the height down from the layer to the altitude of the transmission chord at the terminator, r is the radiusof the layer, and the subscripts denote the layers.
Current usage metrics show cumulative count of Article Views (full-text article views including HTML views, PDF and ePub downloads, according to the available data) and Abstracts Views on Vision4Press platform.
Data correspond to usage on the plateform after 2015. The current usage metrics is available 48-96 hours after online publication and is updated daily on week days.
Initial download of the metrics may take a while.