Fig. 12
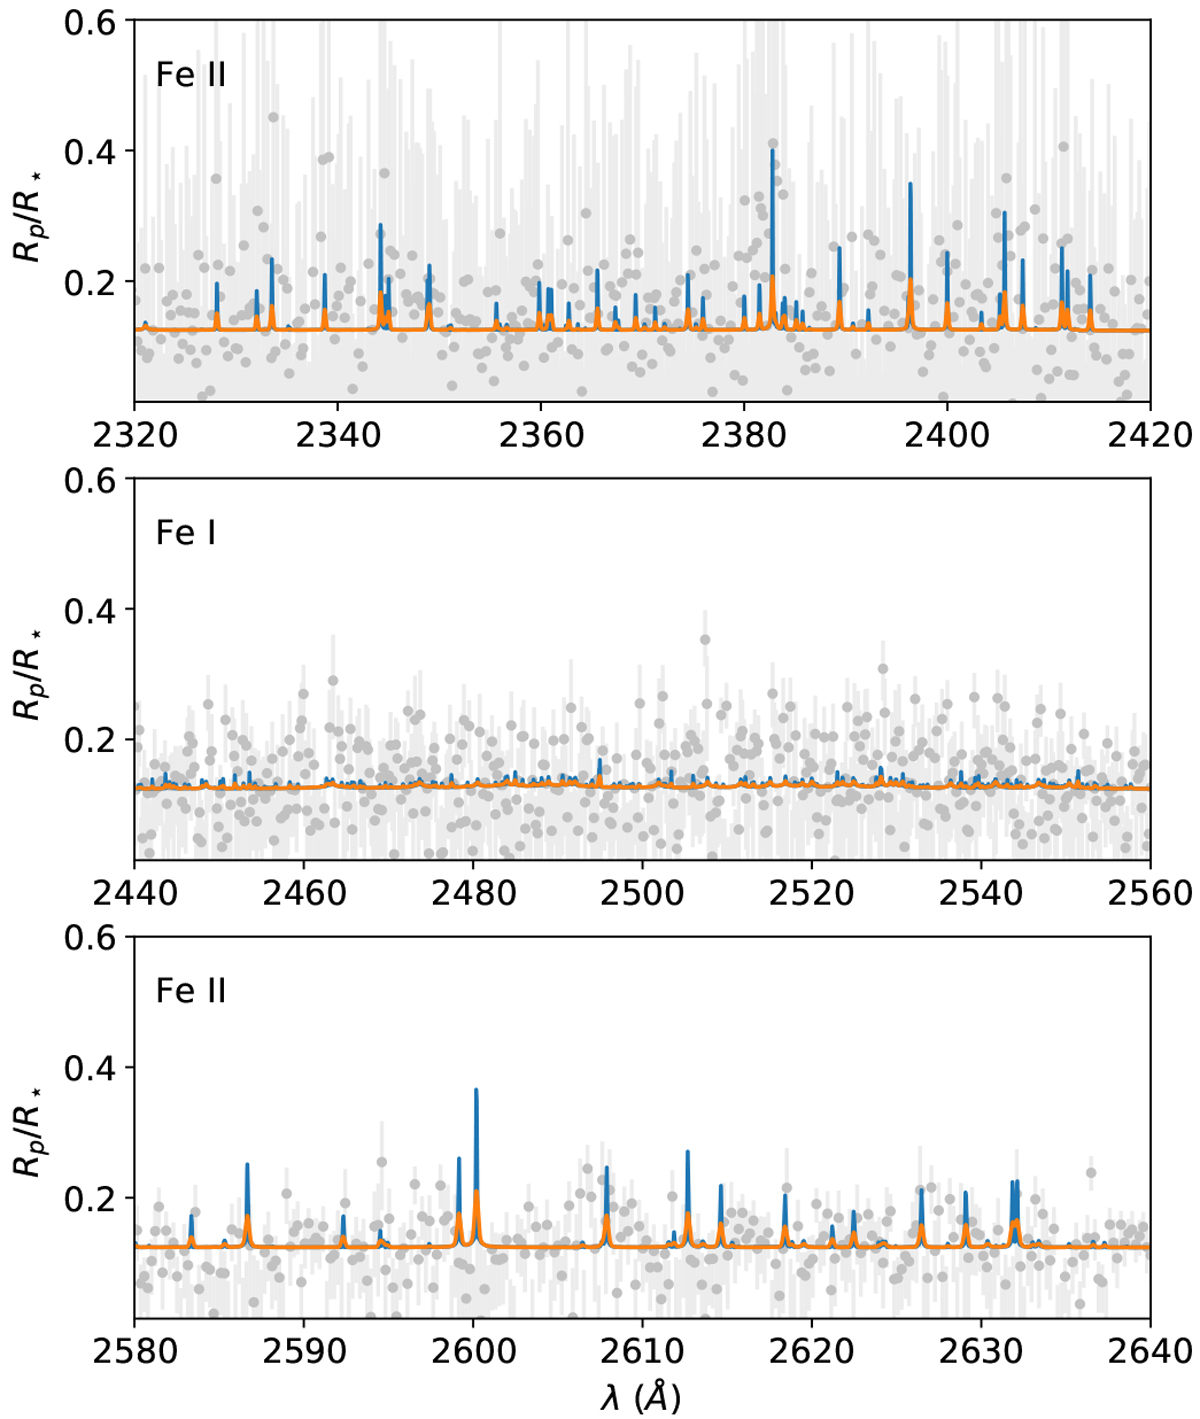
NUV FeI & II bands. The grey points with error bars denote the observed spectrum at a resolution of R ~ 12 000, the blue curve is our high-resolution NLTE spectrum, and the orange curve is our spectrum convolved to the resolution of the observed data. Top and bottom panels: bands of prominent FeII lines and the middle panel shows a band of FeI lines.
Current usage metrics show cumulative count of Article Views (full-text article views including HTML views, PDF and ePub downloads, according to the available data) and Abstracts Views on Vision4Press platform.
Data correspond to usage on the plateform after 2015. The current usage metrics is available 48-96 hours after online publication and is updated daily on week days.
Initial download of the metrics may take a while.