Fig. 10
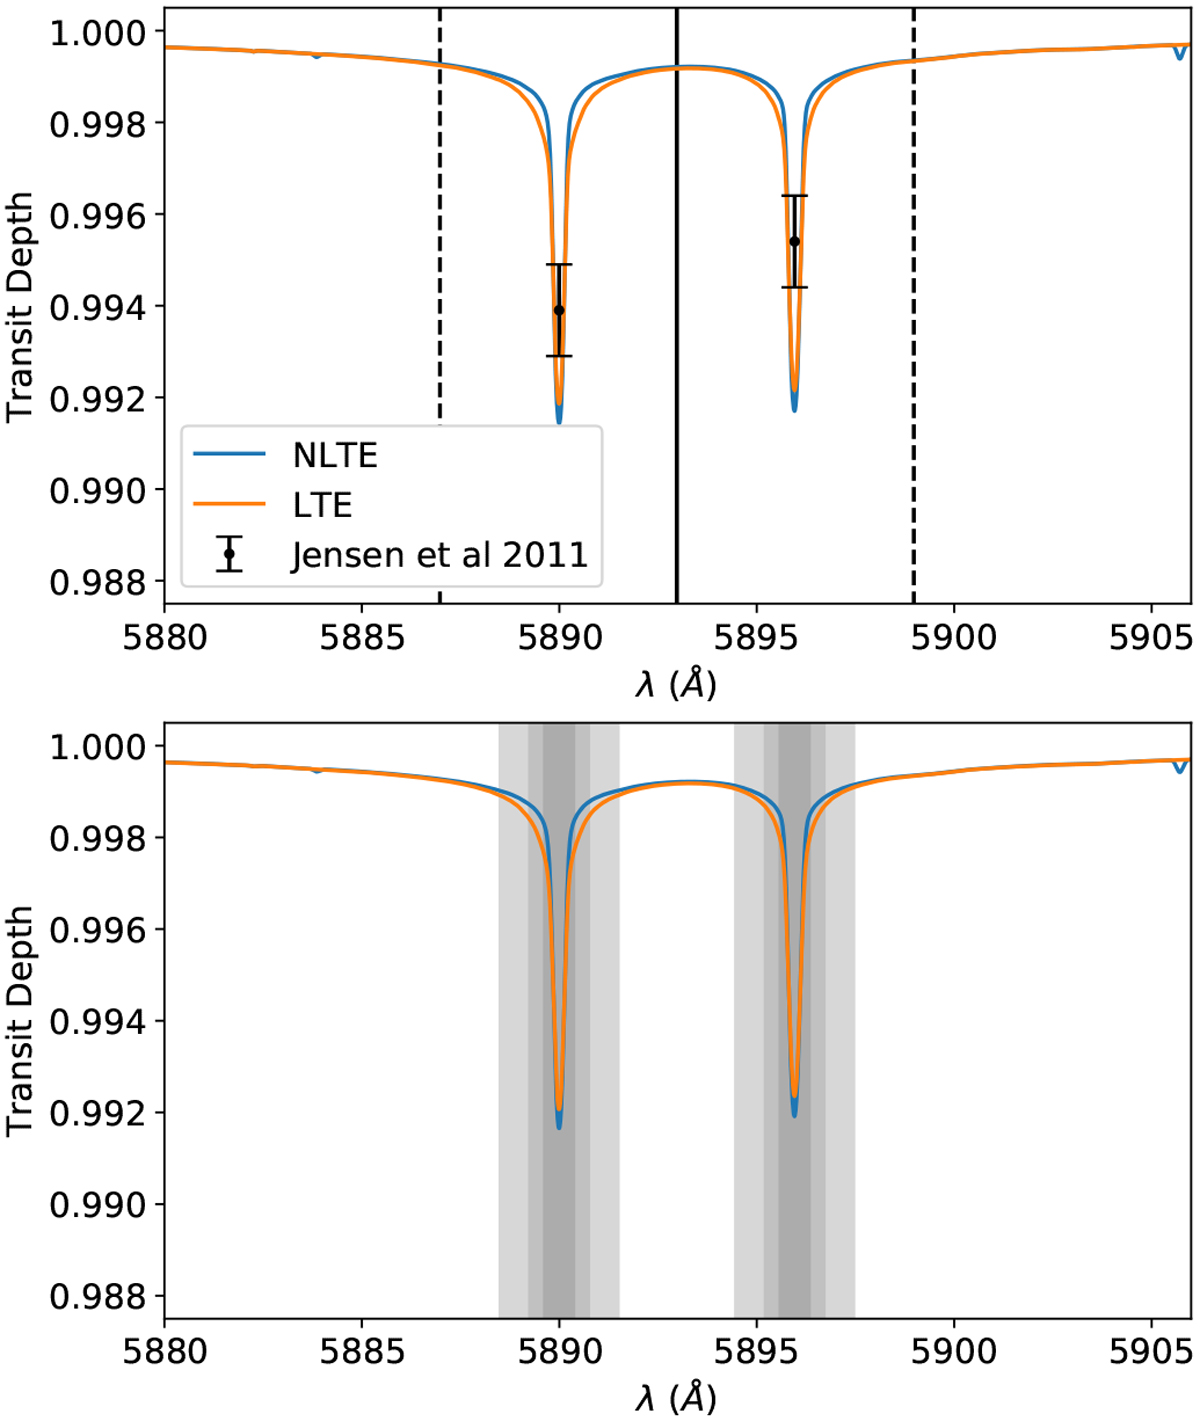
NaI D doublet lines in our NLTE and LTE model spectra. Top: HET HRS comparison spectra (R = 65 000). The solid black line indicates the position centred between the two line cores and the dashed lines indicate the boundaries of the central 12 Å band. The black points indicate the observed core absorption of the lines. Bottom: Subaru HDS comparison spectra (R = 45 000). The shaded areas indicate the narrow (0.75 Å), medium (1.5 Å), and wide (3.0 Å) passbands used in the analysis.
Current usage metrics show cumulative count of Article Views (full-text article views including HTML views, PDF and ePub downloads, according to the available data) and Abstracts Views on Vision4Press platform.
Data correspond to usage on the plateform after 2015. The current usage metrics is available 48-96 hours after online publication and is updated daily on week days.
Initial download of the metrics may take a while.