Fig. 1
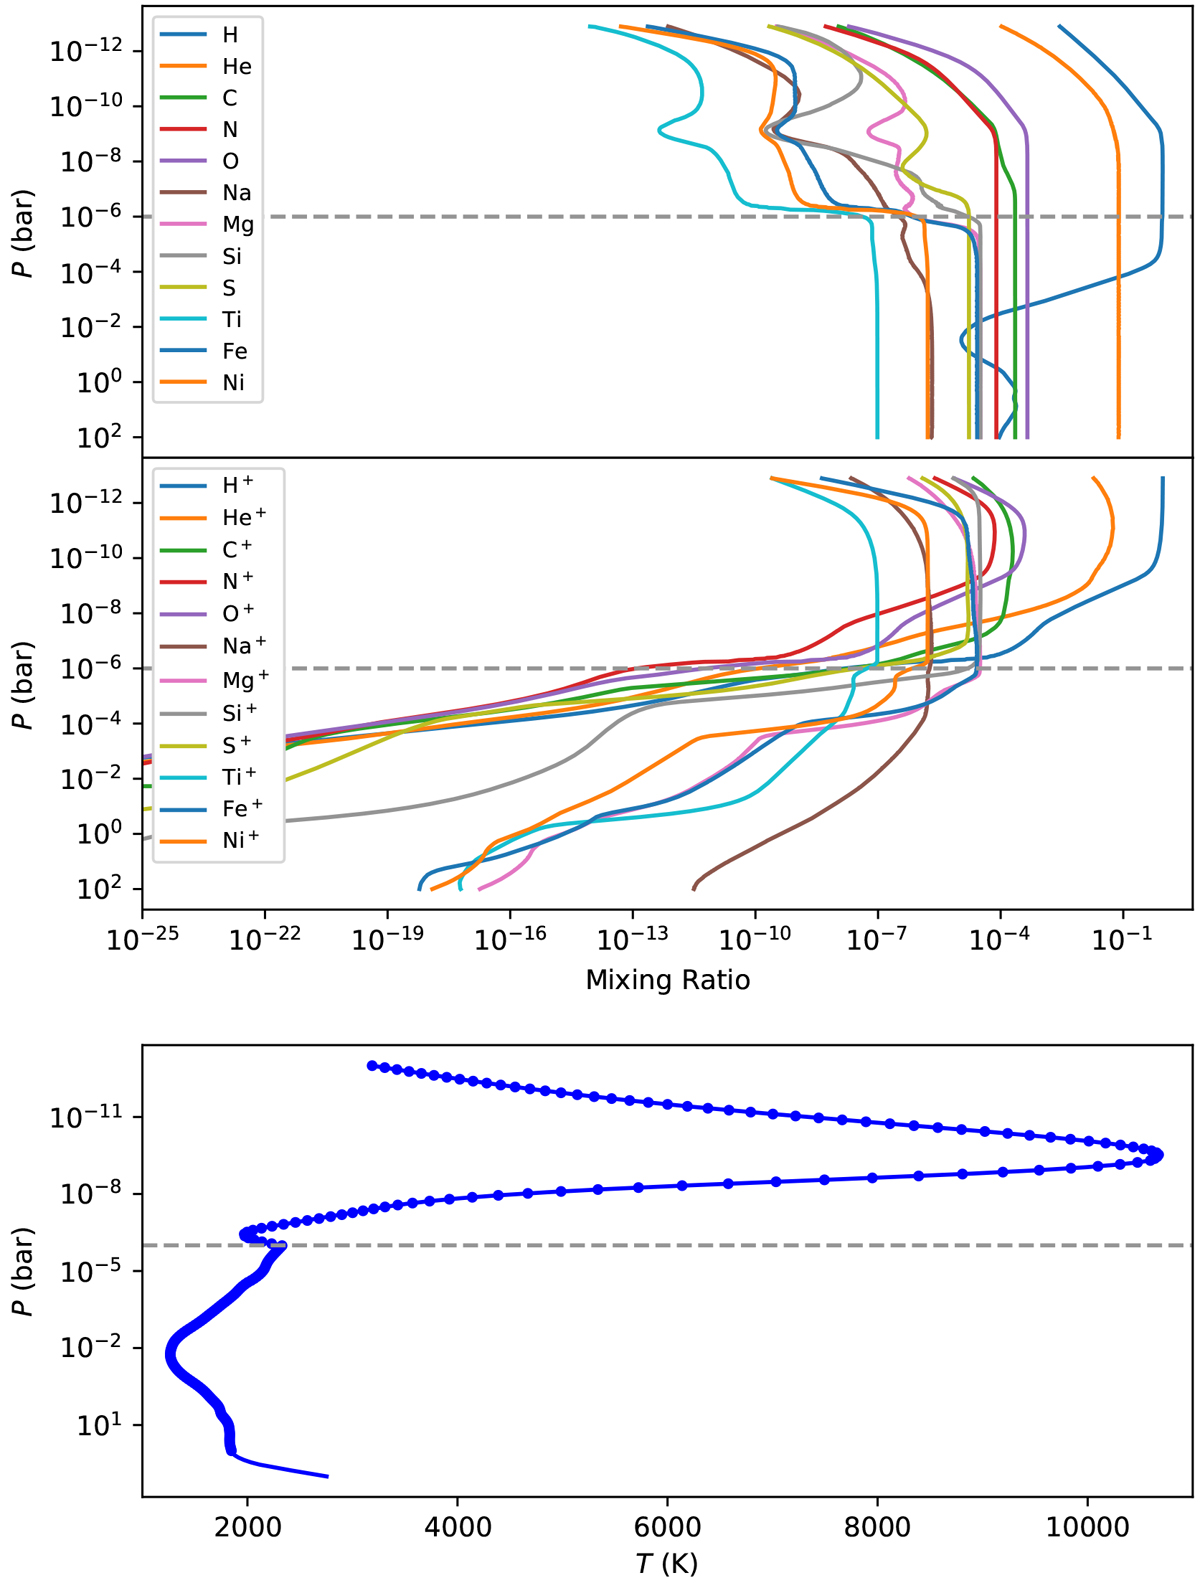
HD 209458b 1D atmospheric model mixing ratios (top) and temperature profile (bottom). Mixing ratios are day-side averages calculated by Cloudy. The temperature profile is taken from Lavvas et al. (2014; lower) and Koskinen et al. (2013; upper), joined at 1 μbar (dashed greyline). The dots indicate the 200 points to which the T–P profile has been re-sampled.
Current usage metrics show cumulative count of Article Views (full-text article views including HTML views, PDF and ePub downloads, according to the available data) and Abstracts Views on Vision4Press platform.
Data correspond to usage on the plateform after 2015. The current usage metrics is available 48-96 hours after online publication and is updated daily on week days.
Initial download of the metrics may take a while.