Fig. 8.
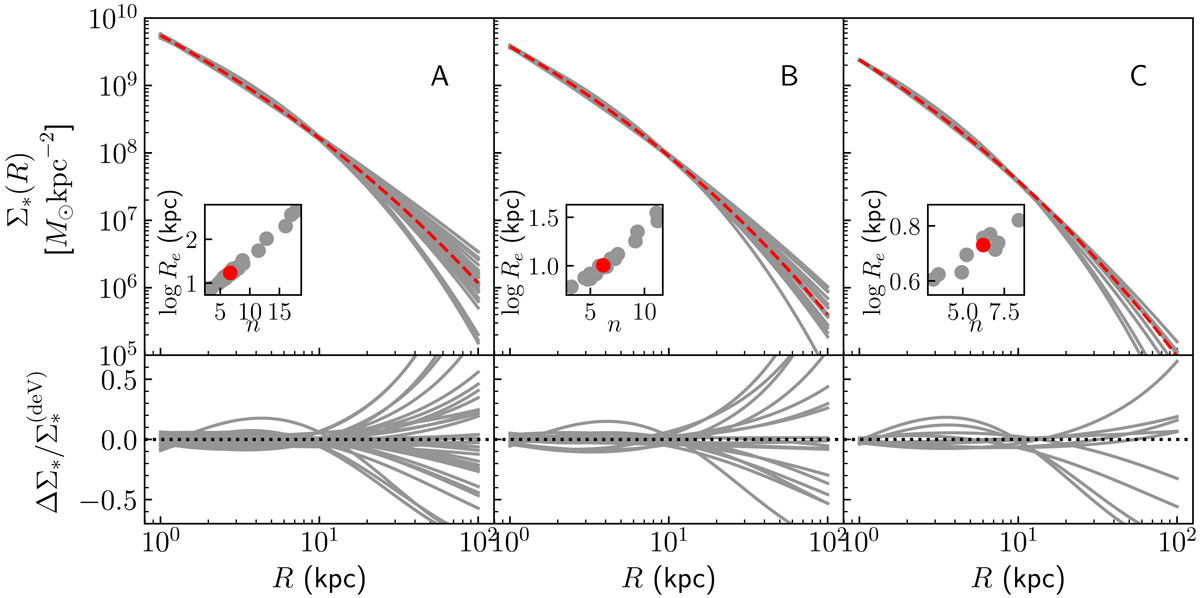
Top: stellar density profile, as inferred in Sect. 2.5, of the galaxies in each of the three bins in (M*,10, Γ*,10) shown in Fig. 7. The red dashed line is the stellar density profile of a Sérsic profile with the same index n as the median among galaxies in the bin, and the same value of M*,10 and Γ*,10 as the centre of the bin. The inset shows the distribution in Sérsic index and half-light radius of each galaxy. Bottom: residual between the stellar mass density of each galaxy in the bin and that of the reference profile with the same M*,10 and Γ*,10 as the centre of the bin, divided by the latter.
Current usage metrics show cumulative count of Article Views (full-text article views including HTML views, PDF and ePub downloads, according to the available data) and Abstracts Views on Vision4Press platform.
Data correspond to usage on the plateform after 2015. The current usage metrics is available 48-96 hours after online publication and is updated daily on week days.
Initial download of the metrics may take a while.