Fig. 6.
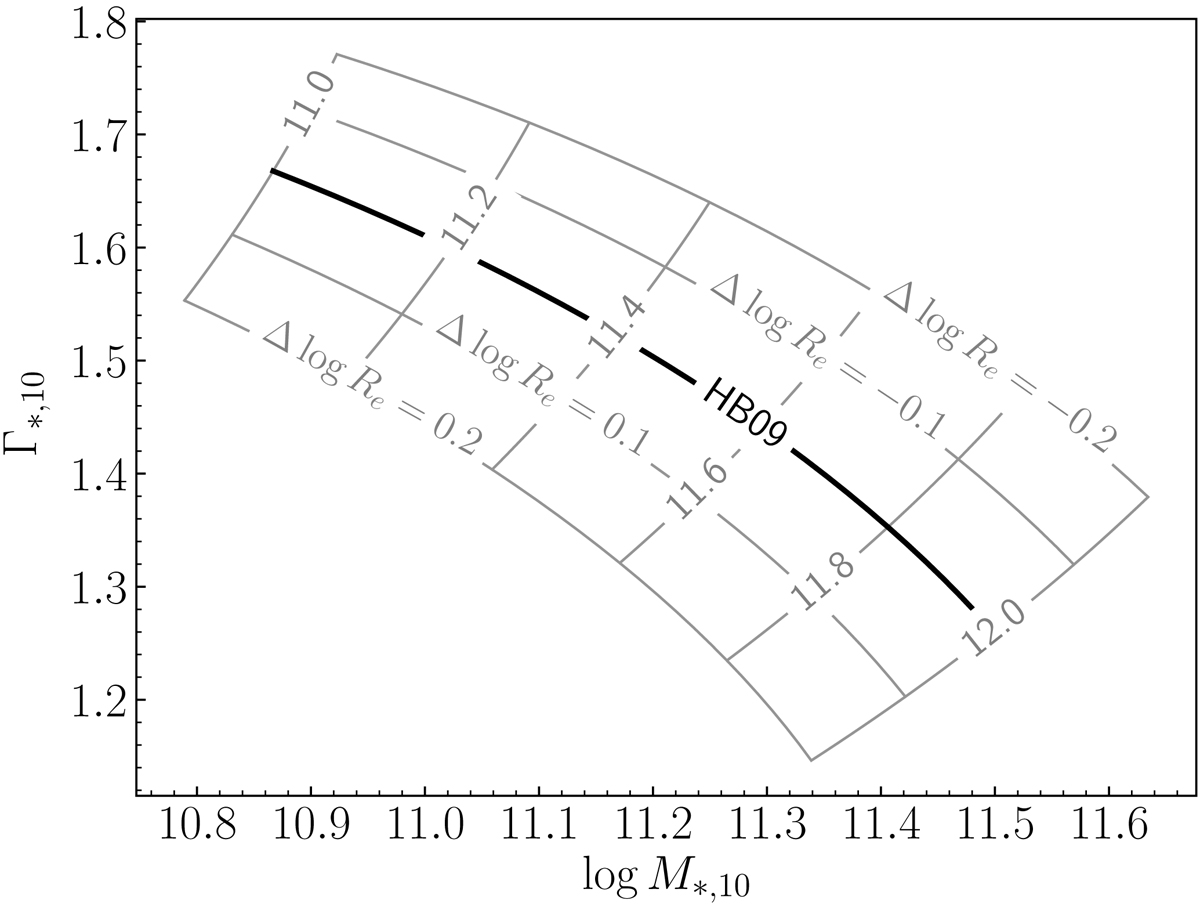
Distribution in M*,10 − Γ*,10 space of galaxies following the average mass-size relation from HB09 (thick line). Lines parallel to it refer to galaxies offset from the average by a fixed amount in log Re, as described on the labels. Lines perpendicular to the HB09 relation are obtained by varying the half-light radius at fixed total stellar mass (the numbers shown on each line are the corresponding values of log M*).
Current usage metrics show cumulative count of Article Views (full-text article views including HTML views, PDF and ePub downloads, according to the available data) and Abstracts Views on Vision4Press platform.
Data correspond to usage on the plateform after 2015. The current usage metrics is available 48-96 hours after online publication and is updated daily on week days.
Initial download of the metrics may take a while.